Vertically integrated manufacturing solutions provider Mayville Engineering Company (NYSE: MEC) reported revenue ahead of Wall Street’s expectations in Q3 2026, with revenue up 18.1% year on year to $170.4 million. The company expects the full year’s revenue to be around $635 million, close to analysts’ consensus estimates. Its non-GAAP profit of $0.15 per share was 28.3% above analysts’ consensus estimates.
For more on Mayville Engineering, read our free full research report.
Mayville Engineering (MEC) Q3 2026 highlights:
- Revenue $170.4 million vs S&P analysts’ consensus estimates of $165 million (18.1% year-on-year growth, 3.2% beat)
- Adjusted EPS $0.15 vs S&P analysts’ consensus estimates of $0.12 (28.3% beat)
- Adjusted EBITDA $16.96 million vs analysts’ consensus estimates of $17.05 million (10% margin, 0.5% miss)
- Revenue guidance The company reconfirmed its revenue guidance for the full year of $635 million at the midpoint
- EBITDA guidance $50 million at the midpoint for the full year, below analysts’ consensus estimates of $55.75 million
- Operating margin 2.5%, up from 0% in the same quarter last year
- Free cash flow -$3.35 million compared to -$1.15 million in the same quarter last year
- Market capitalization $402.1 million
“Our third quarter results were in line with our expectations and reflected strong demand as project volumes continued to accelerate within our Datacenter & Critical Power end market,” said Jag Reddy, President and Chief Executive Officer. “Net sales increased 18.1% year-over-year, driven by continued growth in Datacenter & Critical Power and improving demand across our Commercial Vehicle and Construction & Access end markets. As volumes ramped, Adjusted EBITDA margin improved on a sequential basis through better capacity utilization, while we continued to absorb project launch costs consistent with our expectations. At the same time, operational efficiency across our footprint remained uneven during the quarter as our teams responded to rapidly evolving customer requirements and the pace and volume of incoming demand. We view these dynamics as a natural part of scaling the business through a period of accelerated growth, and our priority remains investing in the people, equipment and capacity required to capture what we believe is a historic, multi-year growth opportunity in the high-value Datacenter & Critical Power space.”
Revenue growth
A company’s long-term revenue performance is one signal of its overall quality. Even a poor business can perform well for one or two quarters, but a high-quality one grows for years. Mayville Engineering’s revenue grew at a mediocre 7% compounded annual growth rate over the last five years, falling short of our standard for the industrials sector.
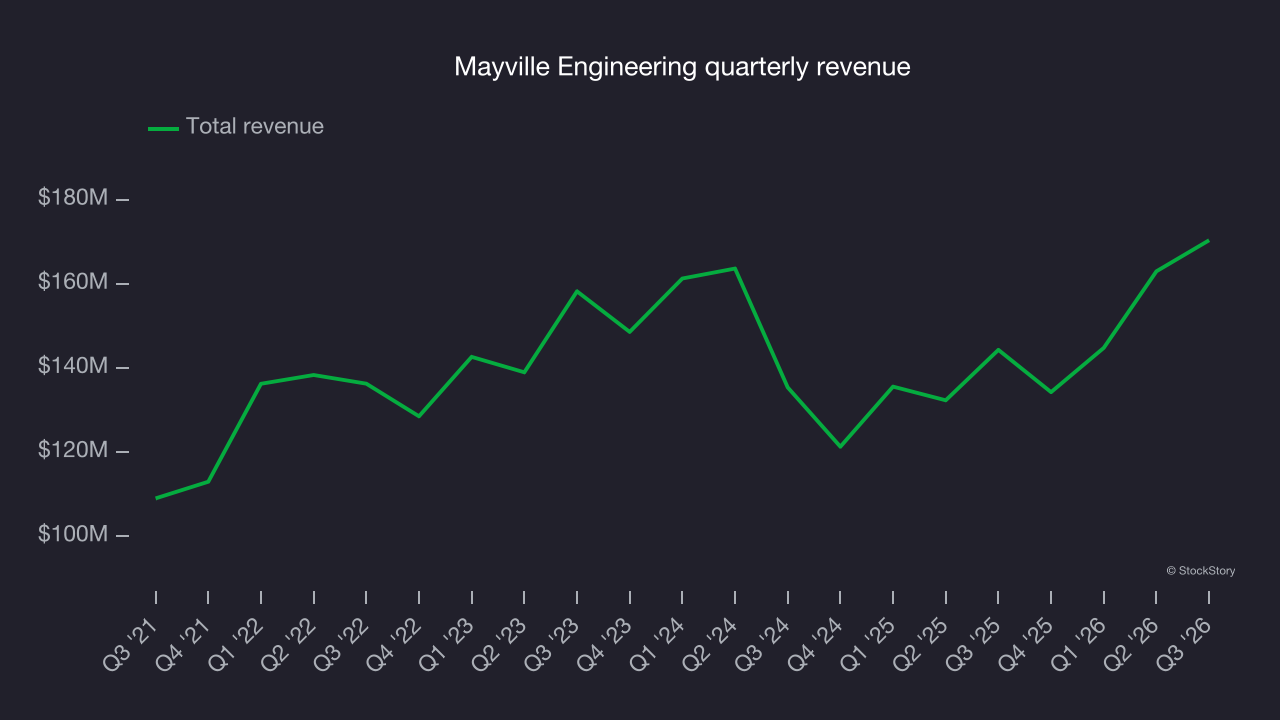
Long-term growth matters most, but within industrials, a half-decade historical view may miss cycles, industry trends or a company capitalizing on catalysts such as a new contract win or a successful product line. Mayville Engineering’s recent performance shows its demand has slowed as its revenue was flat over the last two years. 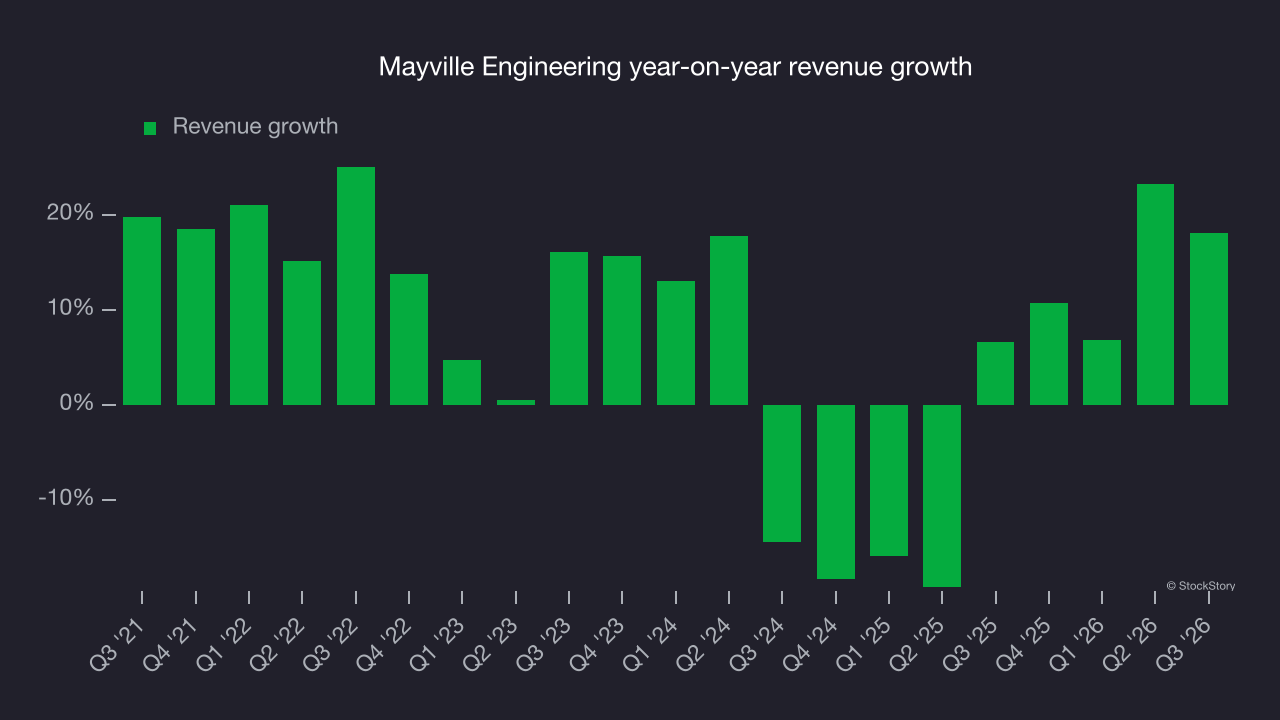
Mayville Engineering also breaks out the revenue for its most important segments, Commercial Vehicle and Construction & Access, which are 31% and 14.2% of revenue. Over the last two years, Mayville Engineering’s Commercial Vehicle revenue (exhaust, engine components and fuel systems) averaged 9.2% year-on-year declines while its Construction & Access revenue (fenders, hoods and frames for heavy machinery) averaged 5.2% declines. 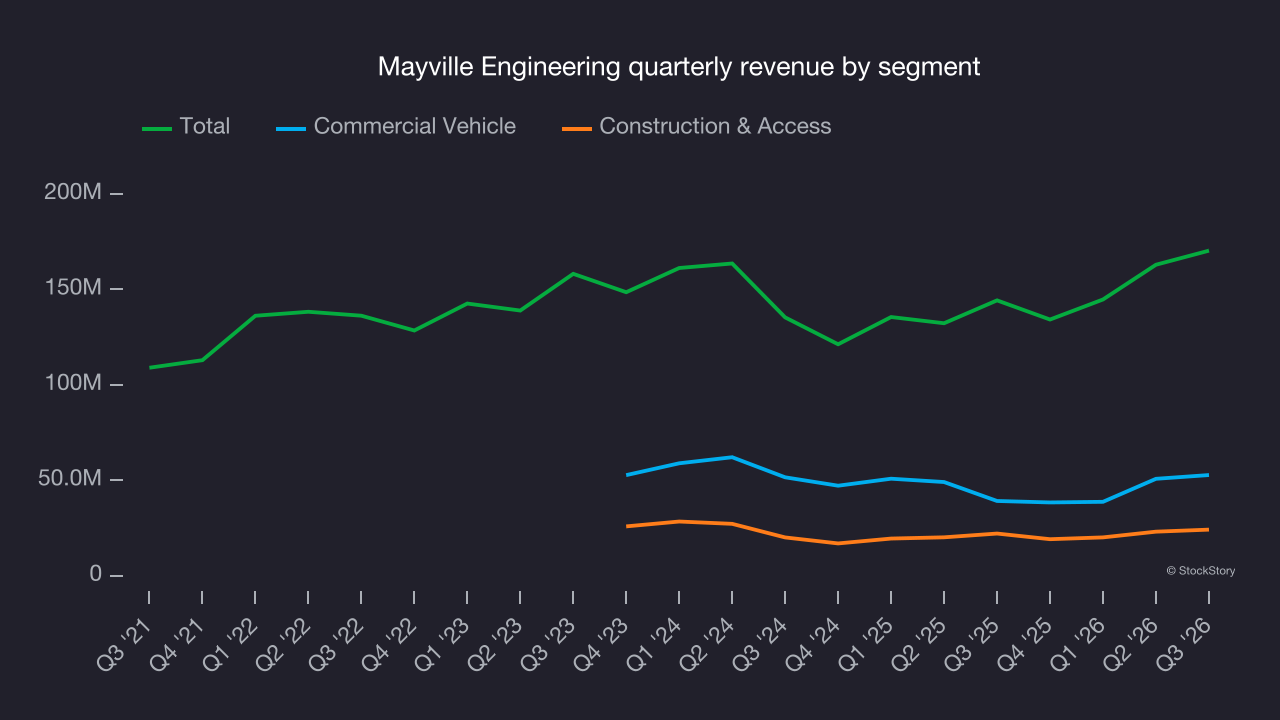
This quarter, Mayville Engineering reported year-on-year revenue growth of 18.1%, and its $170.4 million of revenue exceeded Wall Street’s consensus estimates by 3.2%.
Looking ahead, sell-side analysts expect revenue to grow 17.2% over the next 12 months, according to S&P, an improvement versus the last two years. This strong growth projection implies its newer products and services will spur better revenue performance.
Operating margin
Operating margin is one of the best measures of profitability because it tells us how much money a company takes home after procuring and manufacturing its products, marketing and selling those products and, most importantly, keeping them relevant through research and development.
Mayville Engineering was profitable over the last five years but held back by its large cost base. Its average operating margin of 2.3% was weak for an industrials business. That outcome is unsurprising given its low gross margin baseline.
Looking at the trend in its profitability, Mayville Engineering’s operating margin decreased by 2.5 percentage points over the last five years. This raises questions about the company’s expense base because its revenue growth should have given it leverage on its fixed costs, resulting in better economies of scale and profitability. Mayville Engineering’s performance was poor, showing that costs were rising and it couldn’t pass them on to customers.
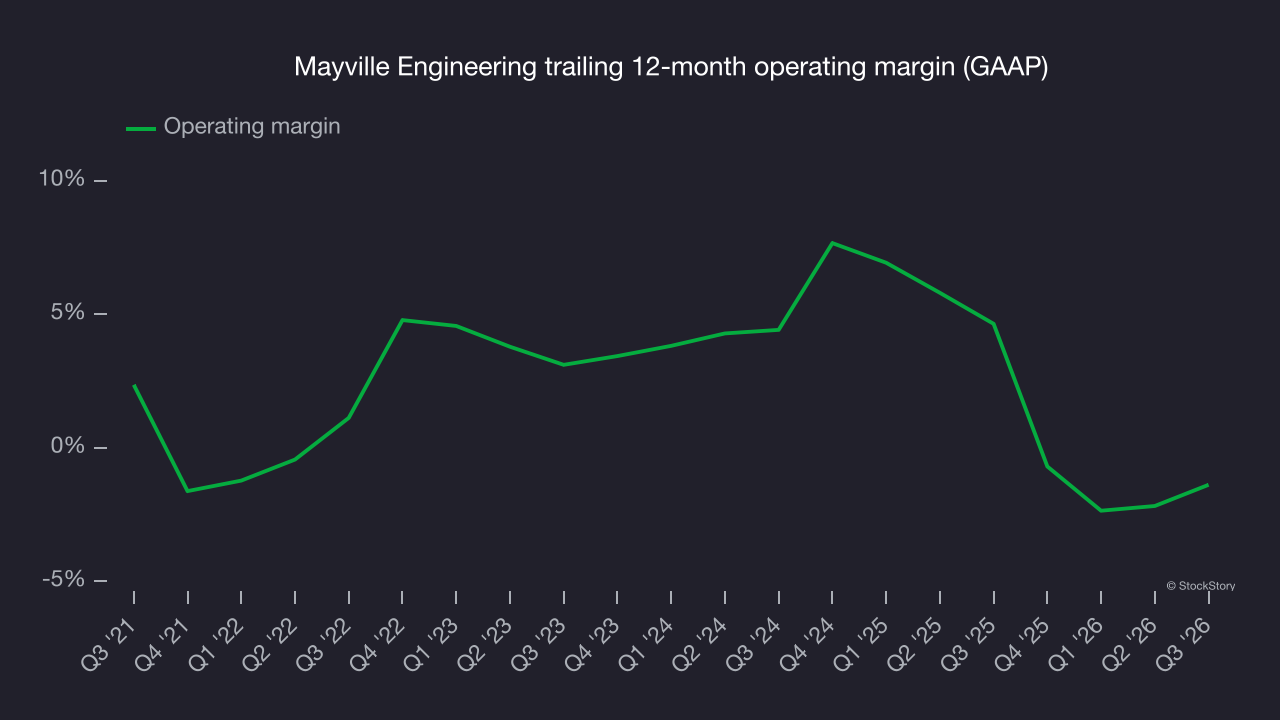
In Q3, Mayville Engineering generated an operating margin of 2.5%, up 2.5 percentage points year on year. The increase was a positive sign and, given the decline in gross margin, indicates greater efficiency as operating expenses such as marketing, research and development and administrative overhead grew more slowly than revenue.
Earnings per share
We track the long-term change in earnings per share (EPS) for the same reason as long-term revenue growth. Compared to revenue, however, EPS highlights whether a company’s growth is profitable.
Mayville Engineering’s EPS declined by 15.2% annually over the last five years while its revenue grew by 7%. However, its operating margin improved during this time, indicating that non-fundamental factors such as interest expenses and taxes affected its ultimate earnings.
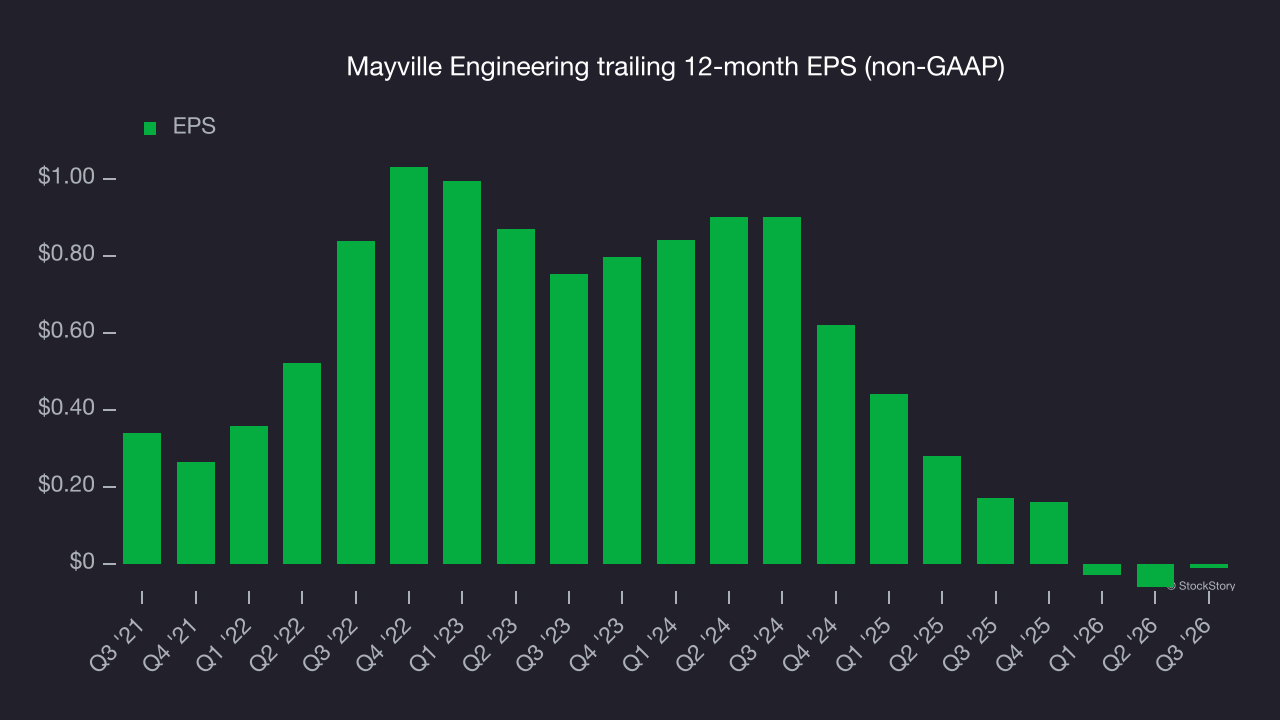
We can take a deeper look into Mayville Engineering’s earnings to better understand the drivers of its performance. As we mentioned earlier, Mayville Engineering’s operating margin expanded this quarter but declined by 2.5 percentage points over the last five years. Its share count also grew by 23.2%, meaning the company not only became less efficient with its operating expenses but also diluted its shareholders. 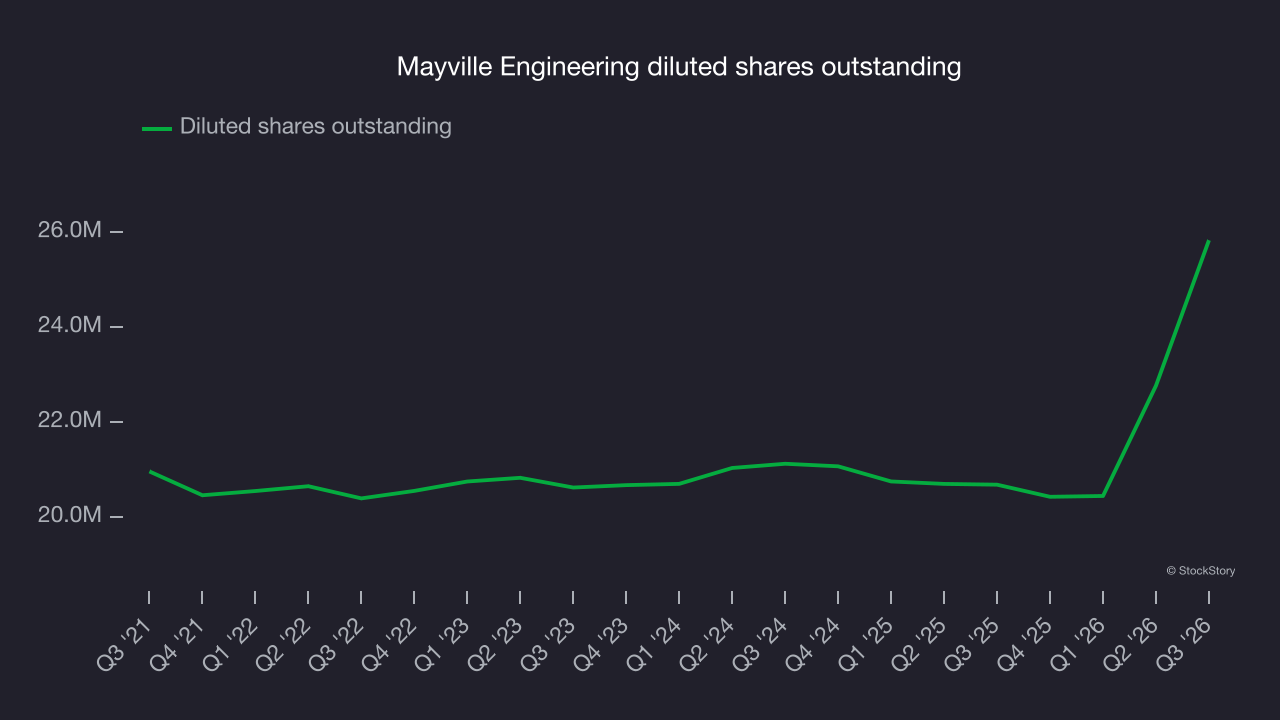
Like with revenue, we analyze EPS over a more recent period because it can provide insight into an emerging theme or development for the business.
For Mayville Engineering, its two-year annual EPS declines of 41.8% show it’s continued to underperform. These were poor results by any measure.
In Q3, Mayville Engineering reported adjusted EPS of $0.15, up from $0.10 in the same quarter last year. This result comfortably beat analysts’ consensus estimates, a positive outcome for shareholders. Over the next 12 months, Wall Street expects improvement. Analysts forecast Mayville Engineering’s full-year EPS will flip from negative $0.01 to positive $0.78, according to S&P.
Key takeaways from Mayville Engineering’s Q3 results
Revenue and EPS topped consensus estimates, giving Mayville Engineering’s mixed quarter some clear positives. EBITDA, however, fell slightly short of Wall Street’s consensus estimates, and full-year EBITDA guidance also missed. Investors were likely hoping for more, as shares tumbled 6.1% to $15.21 immediately after the results.
Is Mayville Engineering a buy at the current price? That decision should take into account its valuation, business qualities and latest earnings. For more, read our full research report here (it’s free).