Industrial and commercial distributor Global Industrial (NYSE: GIC) reported revenue ahead of Wall Street’s expectations in Q3 2026, with revenue up 10.2% year on year to $389.5 million. Its GAAP profit of $0.64 per share was 25.5% above analysts’ consensus estimates.
For more on Global Industrial, read our free full research report.
Global Industrial (GIC) Q3 2026 highlights:
- Revenue $389.5 million vs S&P analysts’ consensus estimates of $385.4 million (10.2% year-on-year growth, 1.1% beat)
- EPS (GAAP) $0.64 vs analysts’ consensus estimates of $0.51 (25.5% beat)
- Operating margin 8.4%, in line with the same quarter last year
- Free cash flow margin 11.1%, up from 6.2% in the same quarter last year
- Market capitalization $1.68 billion
Anesa Chaibi, chief executive officer, said, “Sustained sales momentum, improved profitability and continued execution of our go-to-market strategy drove another strong quarter for Global Industrial. Third quarter revenue increased 10.2% and we delivered our fourth consecutive quarter of high-single digit average daily sales growth, up 8.5%. Revenue growth was led by our industrial and retail customer verticals and strong double-digit performance among our largest strategic accounts.”
Revenue growth
A company’s long-term revenue performance is one signal of its overall quality. Any business can have short-term success, but a top-tier one grows for years. Over the last five years, Global Industrial grew its revenue at a mediocre 6.5% compounded annual growth rate, falling short of our standard for the industrials sector.
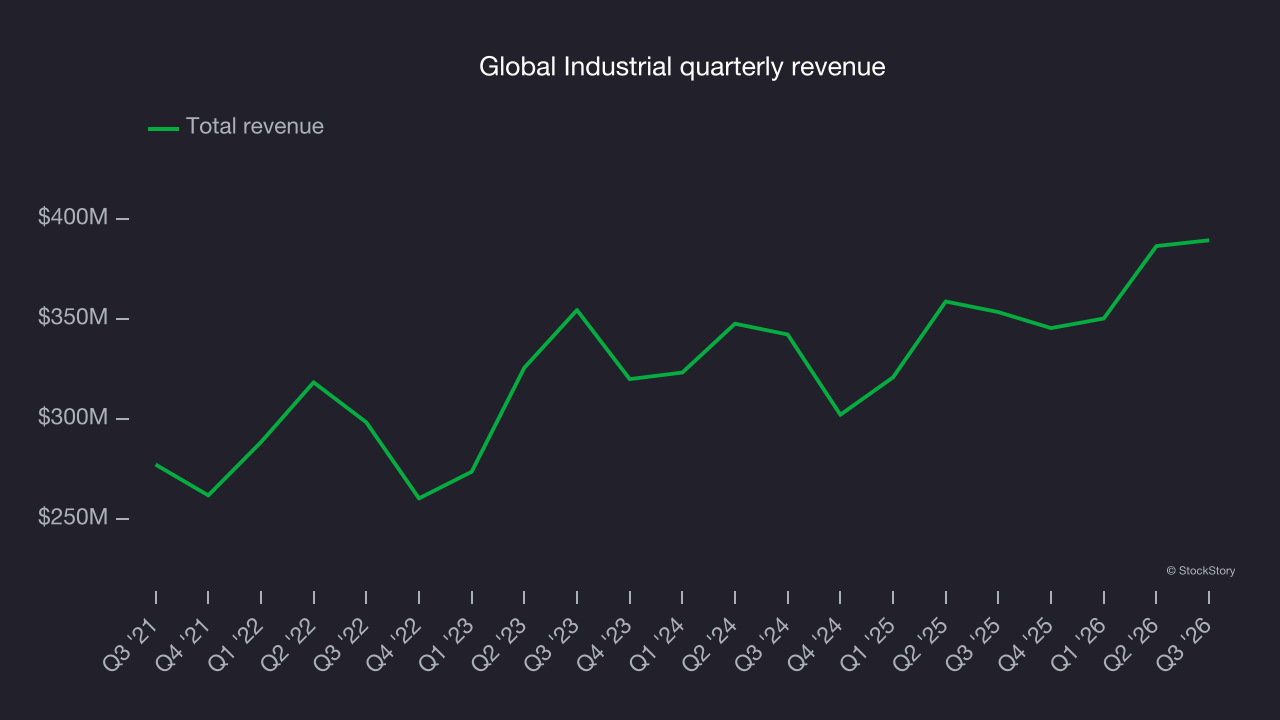
Long-term growth matters most, but within industrials, a half-decade historical view may miss cycles, industry trends or a company capitalizing on catalysts such as a new contract win or a successful product line. Global Industrial’s recent performance shows its demand has slowed as its annualized revenue growth of 5.1% over the last two years was below its five-year trend. Decelerating revenue growth in the sector warrants caution, as it could signal changing consumer tastes aided by low switching costs. 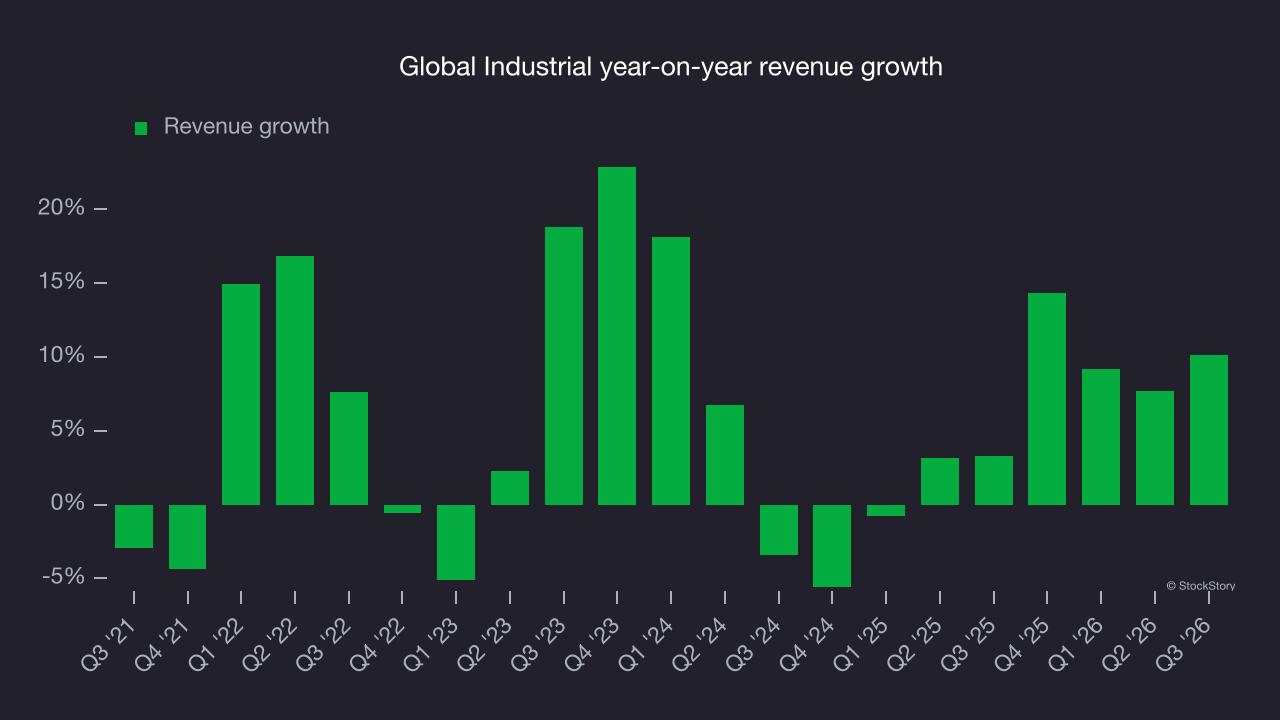
This quarter, Global Industrial reported year-on-year revenue growth of 10.2%, and its $389.5 million of revenue exceeded Wall Street’s consensus estimates by 1.1%.
Looking ahead, sell-side analysts expect revenue to grow 4% over the next 12 months, according to S&P, similar to its two-year rate. This uninspiring projection implies its products and services will see some demand headwinds.
Operating margin
Operating margin is an important measure of profitability as it shows the portion of revenue left after accounting for all core expenses, from the cost of goods sold to advertising and wages. It’s also useful for comparing profitability across companies with different levels of debt and tax rates because it excludes interest and taxes.
Global Industrial was profitable over the last five years but held back by its large cost base. Its average operating margin of 7.5% was weak for an industrials business. That outcome is surprising given its high gross margin baseline.
Looking at the trend in its profitability, Global Industrial’s operating margin decreased by 2.9 percentage points over the last five years. This raises questions about the company’s expense base because its revenue growth should have given it leverage on its fixed costs, resulting in better economies of scale and profitability. Global Industrial’s poor performance shows that costs were rising and it couldn’t pass them on to its customers.
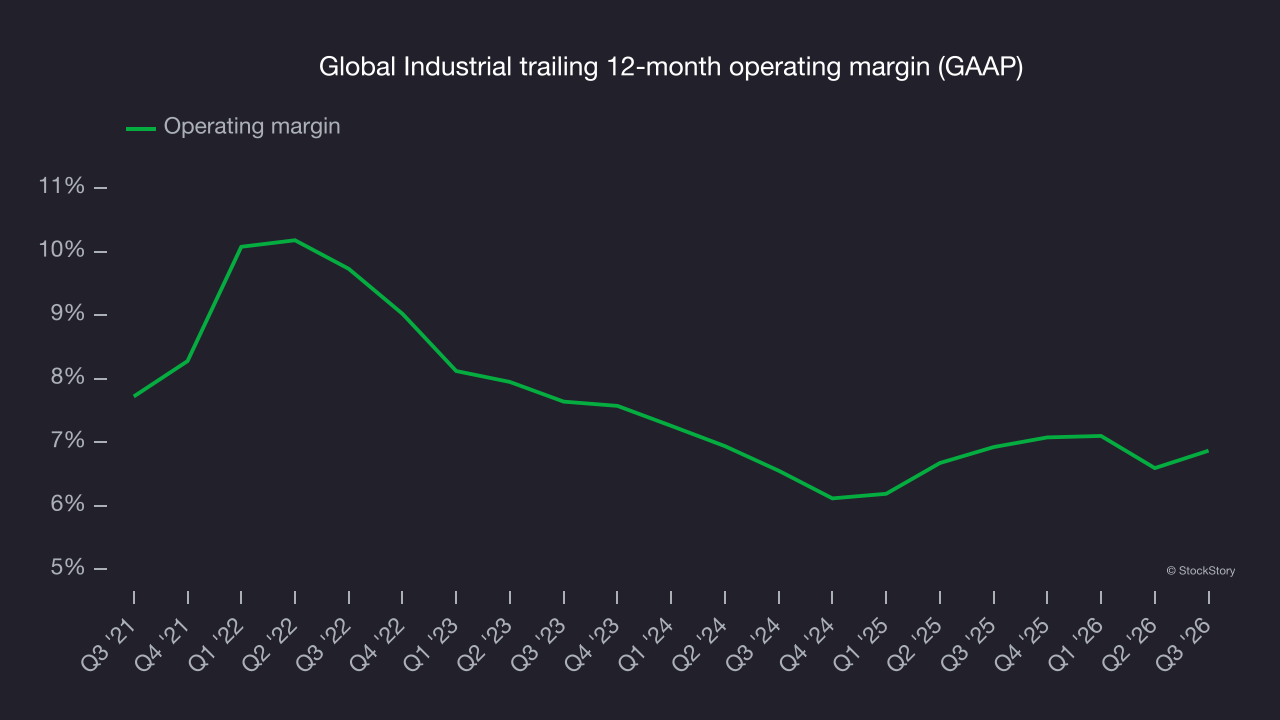
This quarter, Global Industrial generated an operating margin of 8.4%, in line with the same quarter last year. This indicates the company’s cost structure has recently been stable.
Earnings per share
Revenue trends explain a company’s historical growth, but the long-term change in earnings per share (EPS) points to the profitability of that growth – for example, a company could inflate its revenue through excessive spending on advertising and promotions.
Global Industrial’s EPS grew at a weak 3.7% compounded annual growth rate over the last five years, lower than its 6.5% annualized revenue growth. This tells us the company became less profitable on a per-share basis as it expanded.
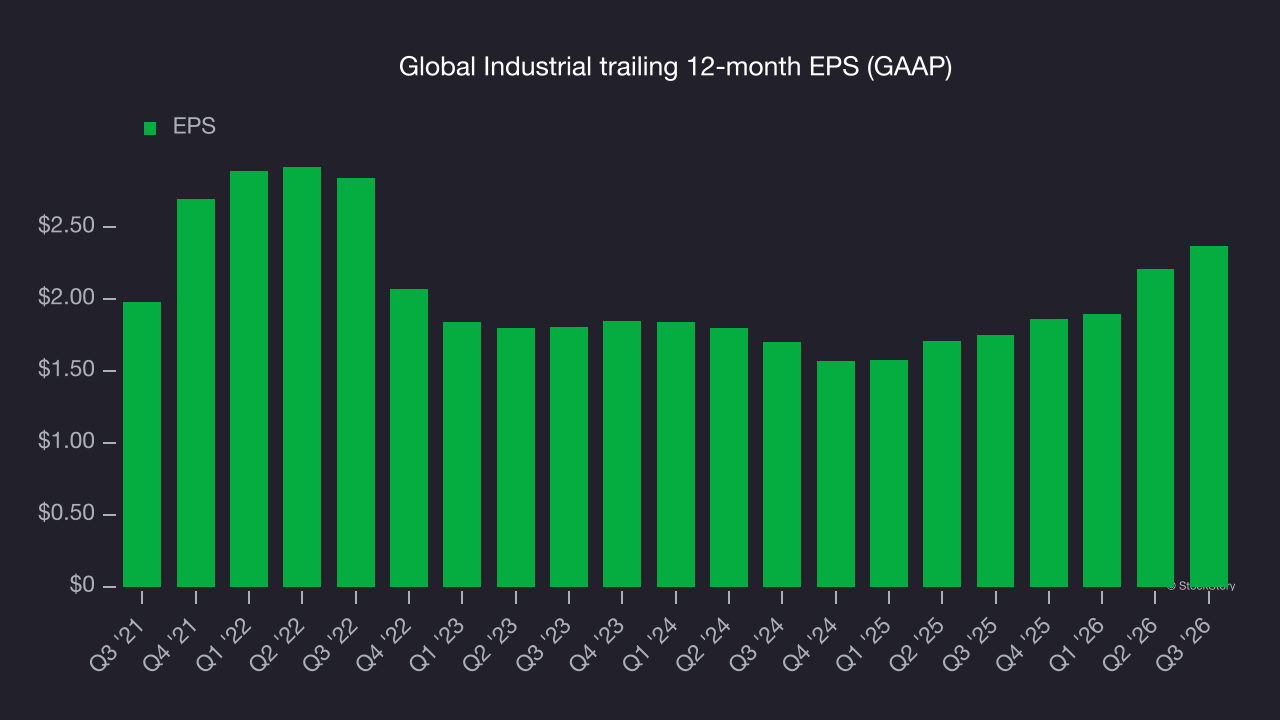
A closer look at Global Industrial’s earnings helps explain its performance. As mentioned earlier, Global Industrial’s operating margin was flat this quarter but declined by 2.9 percentage points over the last five years. This was the most relevant factor (aside from the revenue impact) behind its lower earnings; interest expenses and taxes can also affect EPS but don’t tell us as much about a company’s fundamentals.
As with revenue, a shorter-term view of EPS can help identify changes in the business.
For Global Industrial, its two-year annual EPS growth of 18.1% was higher than its five-year trend. This acceleration made it one of the faster-growing industrials companies in recent history.
In Q3, Global Industrial reported EPS of $0.64, up from $0.48 in the same quarter last year. The result comfortably topped analysts’ consensus estimates, a positive outcome for shareholders. Over the next 12 months, Wall Street expects Global Industrial’s full-year EPS to shrink by 9.3% from $2.37 to $2.15, according to S&P.
Key takeaways from Global Industrial’s Q3 results
Global Industrial delivered a solid quarter, with EPS beating analysts’ consensus estimates and revenue finishing narrowly ahead of Wall Street’s consensus. Shares rose 3.8% to $45.81 immediately after the results.
Global Industrial had a solid quarter, but one earnings result doesn’t necessarily make the stock a buy. When making that decision, consider the bigger picture of valuation and business quality as well as the latest earnings. Read our full research report here (it’s free).