Healthcare technology company GE HealthCare Technologies (NASDAQ: GEHC) reported Q3 2026 results exceeding the market’s revenue expectations, with revenue up 7.2% year on year to $5.51 billion. Its non-GAAP profit of $1.34 per share was 11.3% above analysts’ consensus estimates.
For more on GE HealthCare, read the full research report for free.
GE HealthCare (GEHC) Q3 2026 highlights:
- Revenue $5.51 billion vs S&P analysts’ consensus estimates of $5.35 billion (7.2% year-on-year growth, 3% beat)
- Adjusted EPS $1.34 vs S&P analysts’ consensus estimates of $1.20 (11.3% beat)
- Adjusted EPS guidance Management raised its full-year adjusted EPS guidance to $5 at the midpoint, a 2% increase
- Operating margin 14.6%, up from 12.7% in the same quarter last year
- Free cash flow margin 14.4%, up from 9.4% in the same quarter last year
- Organic revenue rose 6.2% year on year (beat)
- Market capitalization $32.12 billion
GE HealthCare President and CEO Peter Arduini said, “We delivered strong top-line growth and margin expansion across all segments, and robust EPS growth in the third quarter. This reflects our teams’ commercial execution, disciplined operational focus enabled by Heartbeat, and continued customer adoption of our innovations. With our improved performance year-to-date and momentum in the business, we are raising guidance for the year.”
Revenue growth
A company’s long-term performance is an indicator of its overall quality. Any business can have short-term success, but a top-tier one grows for years. GE HealthCare’s revenue grew at a mediocre 4.2% compounded annual growth rate over the last five years, falling short of the healthcare sector standard.
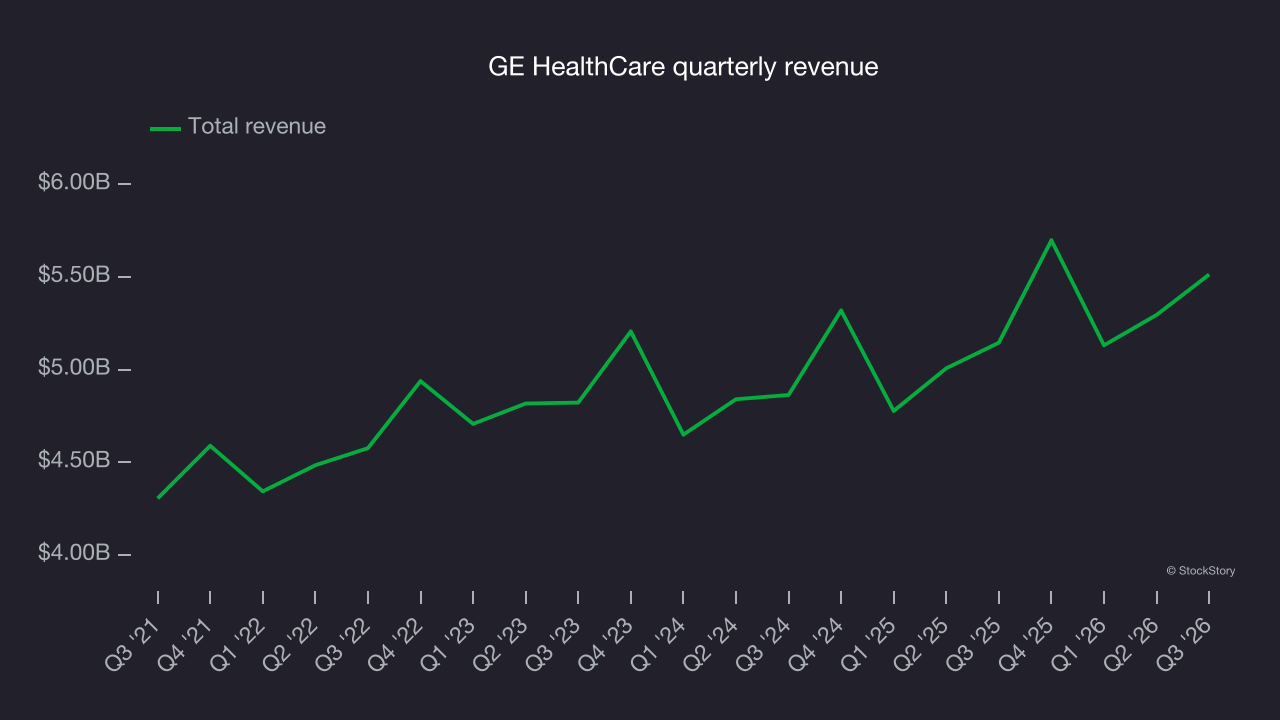
Long-term growth is the most important, but within healthcare, a half-decade historical view may miss new innovations or demand cycles. GE HealthCare’s annualized revenue growth of 5.2% over the last two years is above its five-year trend, which is encouraging. 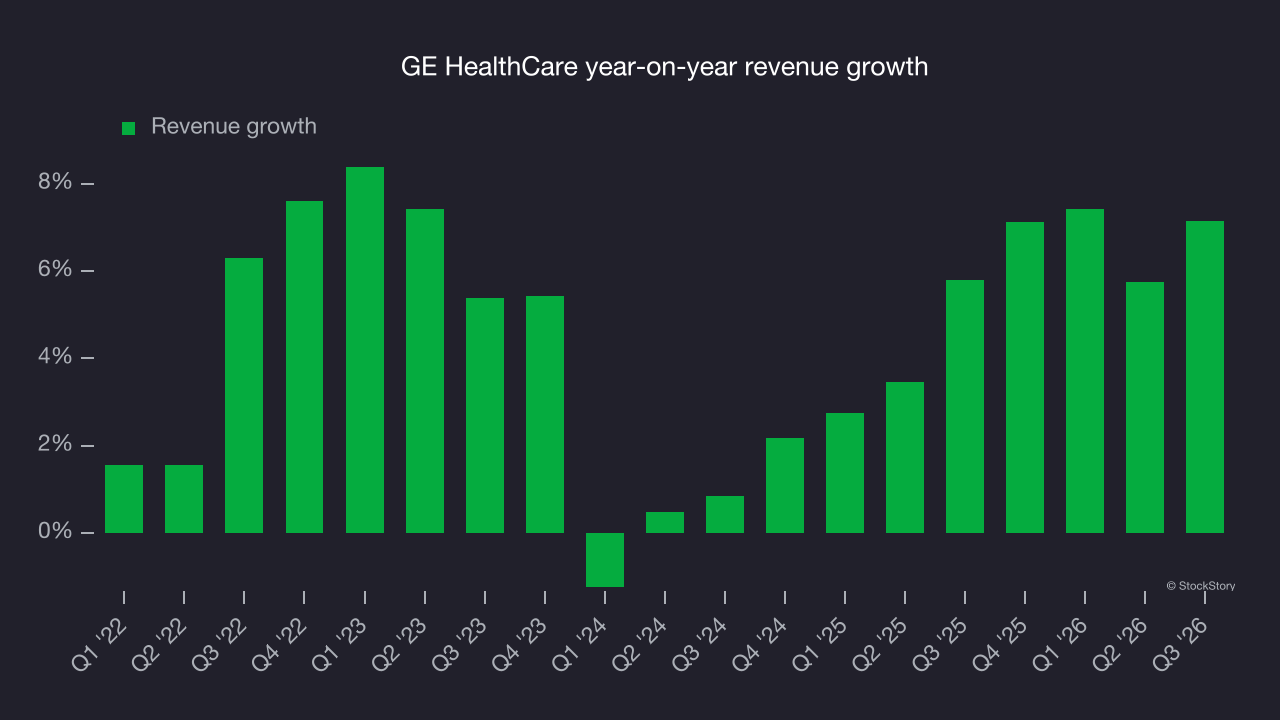
GE HealthCare also reports organic revenue, which strips out one-time events like acquisitions and currency fluctuations that don’t accurately reflect its fundamentals. Over the last two years, GE HealthCare’s organic revenue averaged 3.7% year-on-year growth. Headline revenue growth outpaced organic growth over that period, indicating that a combination of acquisitions and foreign exchange rates boosted its reported results. 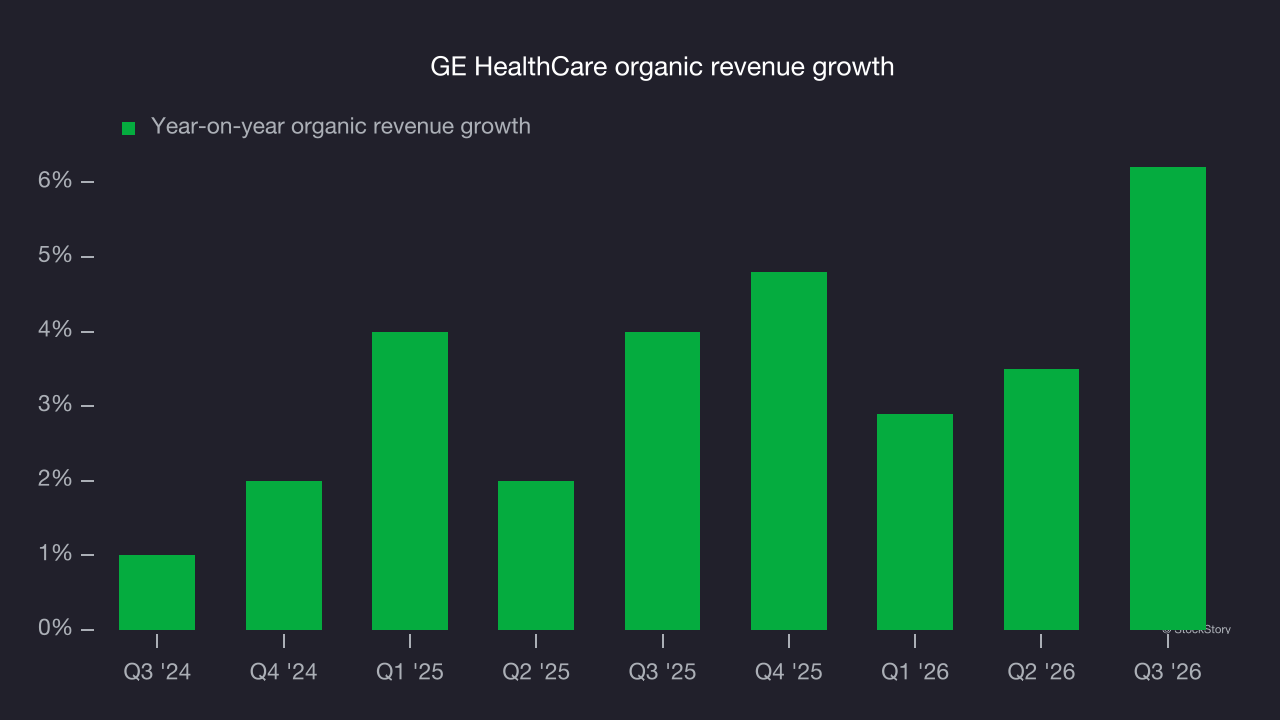
This quarter, GE HealthCare reported year-on-year revenue growth of 7.2%, and its $5.51 billion of revenue exceeded Wall Street’s consensus estimates by 3%.
Looking ahead, sell-side analysts expect revenue to grow 3.6% over the next 12 months, according to S&P, a slight deceleration versus the last two years. This projection is underwhelming and suggests its products and services will face some demand challenges.
Adjusted operating margin
Adjusted operating margin is one of the best measures of profitability because it shows how much a company earns after subtracting all core expenses, such as marketing and R&D. It also removes various one-time costs to provide a clearer picture of normalized profits.
GE HealthCare’s adjusted operating margin has generally stayed the same over the last 12 months, averaging 15.5% over the last five years. This profitability was solid for a healthcare business and shows it’s an efficient company that manages its expenses well.
GE HealthCare’s adjusted operating margin might have fluctuated slightly but has generally stayed the same over the last five years. This raises questions about the company’s expense base because its revenue growth should have given it leverage on its fixed costs, resulting in better economies of scale and profitability.
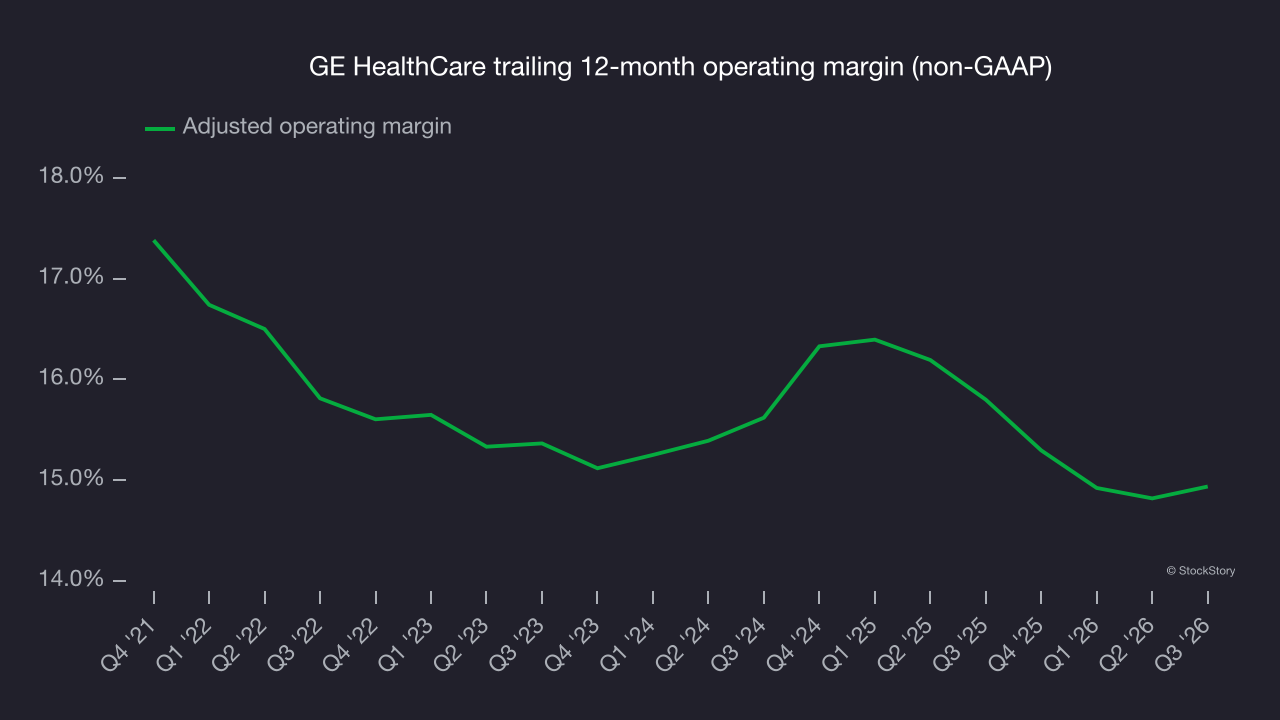
In Q3, GE HealthCare generated an adjusted operating margin of 15.3%, in line with the same quarter last year. This indicates the company’s overall cost structure has been relatively stable.
Cash flow
Earnings are valuable for assessing company performance, but cash is essential because accounting profits can’t pay the bills.
GE HealthCare has shown decent cash profitability, giving it some flexibility to reinvest or return capital to investors. The company’s free cash flow margin averaged 7.9% over the last five years, slightly better than the broader healthcare sector.
GE HealthCare’s margin expanded by 2.8 percentage points during that time. This shows the company is heading in the right direction. It became a less capital-intensive business, as its free cash flow profitability rose while its operating profitability was flat.
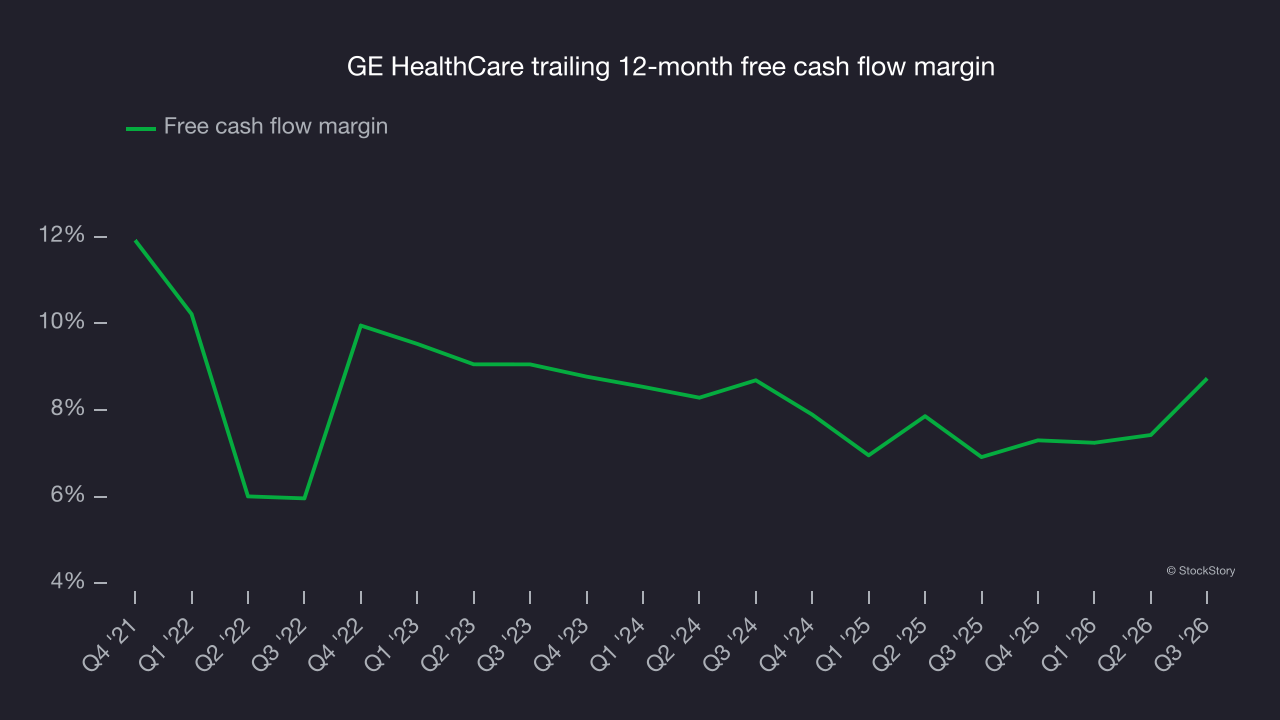
GE HealthCare generated $793 million in free cash flow in Q3, equivalent to a 14.4% margin. This was a positive result, as its margin was 5 percentage points higher than in the same quarter last year, building on its favorable historical trend.
Key takeaways from GE HealthCare’s Q3 results
GE HealthCare delivered a solid Q3, with both organic revenue and total revenue topping analysts’ consensus estimates. Shares rose 4.5% to $74.29 immediately after the results.
GE HealthCare had a solid quarterly earnings result, but is the stock a good investment? The latest quarter is only one piece of the longer-term business quality picture. Quality, when combined with valuation, can help determine if the stock is a buy. For more on GE HealthCare, read our full research report here (it’s free).