Environmental and industrial services company Clean Harbors (NYSE: CLH) announced better-than-expected revenue in Q3 2026, with revenue rising 20.7% year on year to $1.87 billion. Its GAAP profit of $3.93 per share was 21% above analysts’ consensus estimates.
For more on Clean Harbors, read our free full research report.
Clean Harbors (CLH) Q3 2026 highlights:
- Revenue $1.87 billion vs S&P analysts’ consensus estimates of $1.73 billion (20.7% year-on-year growth, 8.3% beat)
- EPS (GAAP) $3.93 vs analysts’ consensus estimates of $3.25 (21% beat)
- Adjusted EBITDA $456.1 million vs analysts’ consensus estimates of $409.1 million (24.4% margin, 11.5% beat)
- EBITDA guidance $1.46 billion at the midpoint for the full year, above analysts’ consensus estimates of $1.42 billion
- Operating margin 17%, up from 12.5% in the same quarter last year
- Free cash flow margin 13.2%, down from 14.9% in the same quarter last year
- Market capitalization $16.52 billion
“Our third-quarter results reflect the strength of our market position and robust demand for our environmental services and sustainable products,” said Eric Gerstenberg, Co-Chief Executive Officer. “Revenues increased 21% and Adjusted EBITDA grew 42% year-over-year, resulting in a record Adjusted EBITDA margin of 24.4%. Environmental Services (ES) delivered better-than-expected results, supported by a sizeable emergency response event, growth in PFAS-related work, strong waste volumes and pricing initiatives designed to offset inflation and higher fuel costs. Safety-Kleen Sustainability Solutions (SKSS) also generated significant profitability, as market pricing for our re-refined products remained high amid global shortages. Together, these results drove record adjusted free cash flow of $323 million. At the same time, we continued to execute safely, with our year-to-date Total Recordable Incident Rate of 0.49 on track to match the best performance in our history.”
Revenue growth
A company’s long-term revenue performance can indicate its overall quality. Any business can have short-term success, but a top-tier one grows for years. Clean Harbors’s 13.5% annualized revenue growth over the last five years was strong. Its growth beat the average industrials company and shows its offerings resonate with customers.
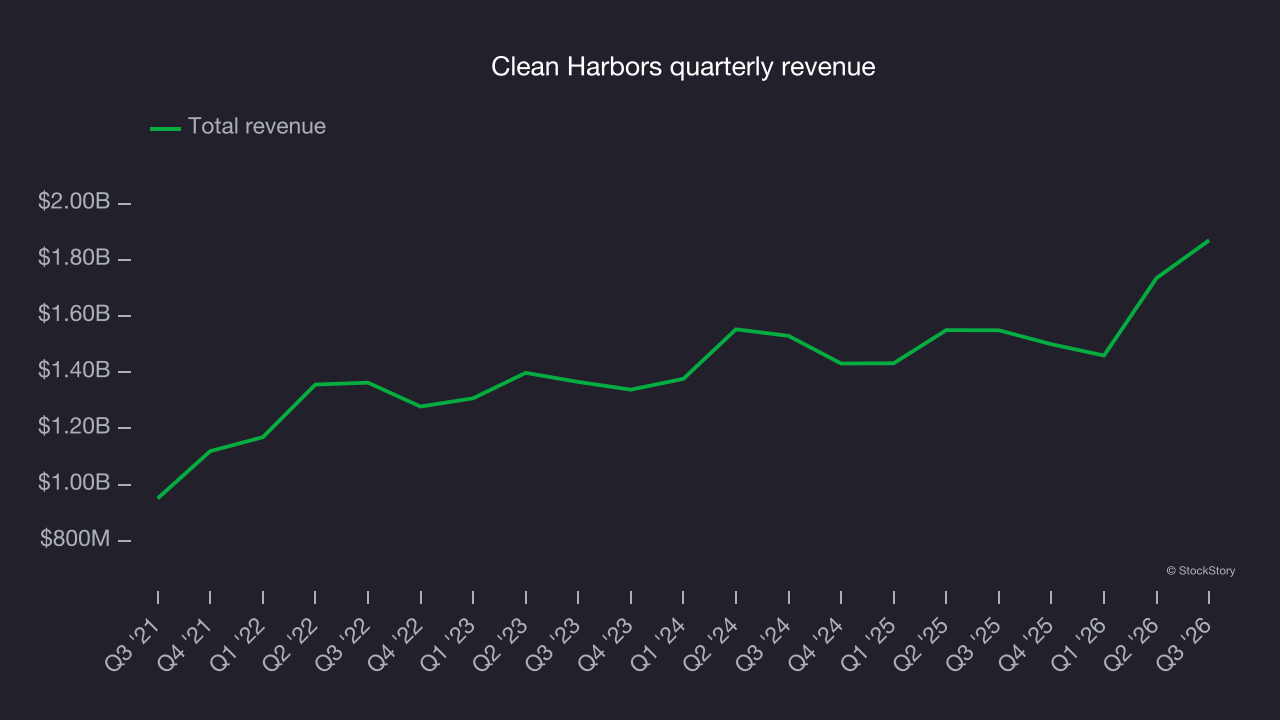
Long-term growth matters most, but within industrials, a half-decade historical view may miss cycles, industry trends or a company capitalizing on catalysts such as a new contract win or a successful product line. Clean Harbors’s recent performance shows its demand has slowed significantly as its annualized revenue growth of 6.4% over the last two years was well below its five-year trend. 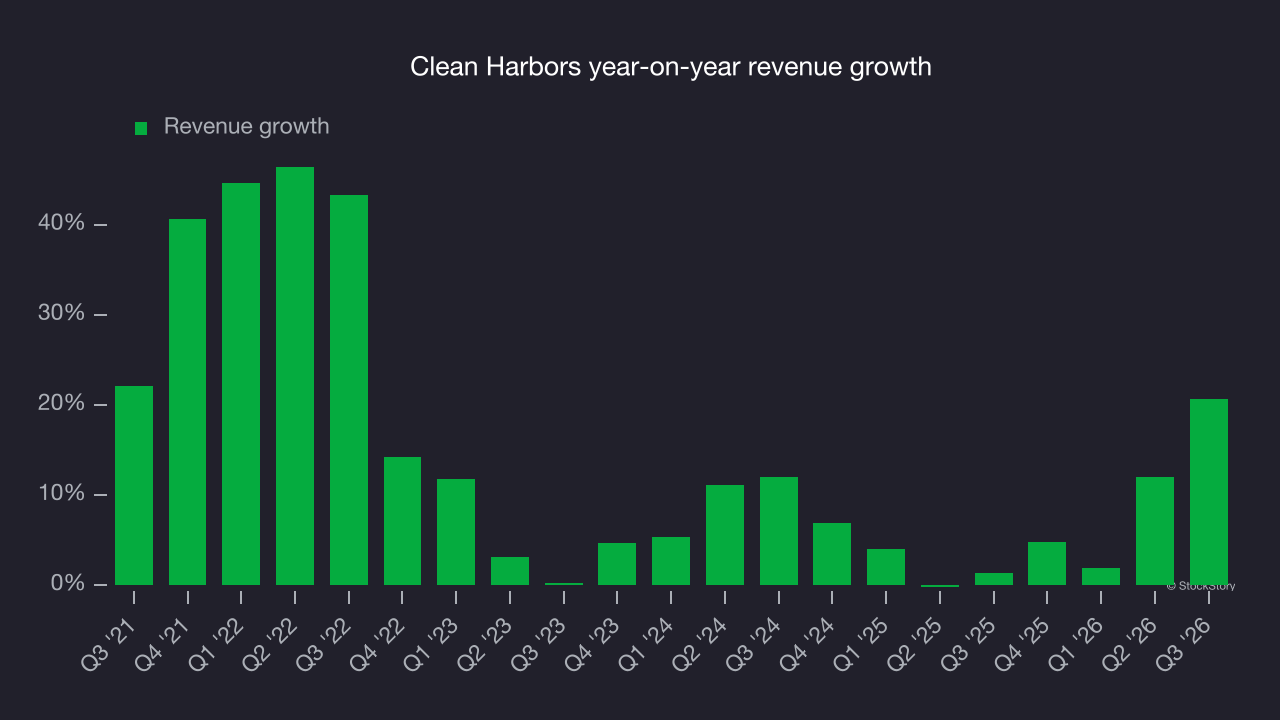
This quarter, Clean Harbors reported year-on-year revenue growth of 20.7%, and its $1.87 billion of revenue topped Wall Street’s consensus estimates by 8.3%.
Looking ahead, sell-side analysts expect revenue to grow 5.4% over the next 12 months, according to S&P, similar to its two-year rate. This projection is underwhelming and indicates its newer products and services will not lead to better top-line performance yet. Still, the company is tracking well in other measures of financial health.
Operating margin
Clean Harbors has managed its cost base well over the last five years. It demonstrated solid profitability for an industrials business, producing an average operating margin of 11.8%.
Looking at the trend in its profitability, Clean Harbors’s operating margin rose by 1.4 percentage points over the last five years, as its revenue growth gave it operating leverage.
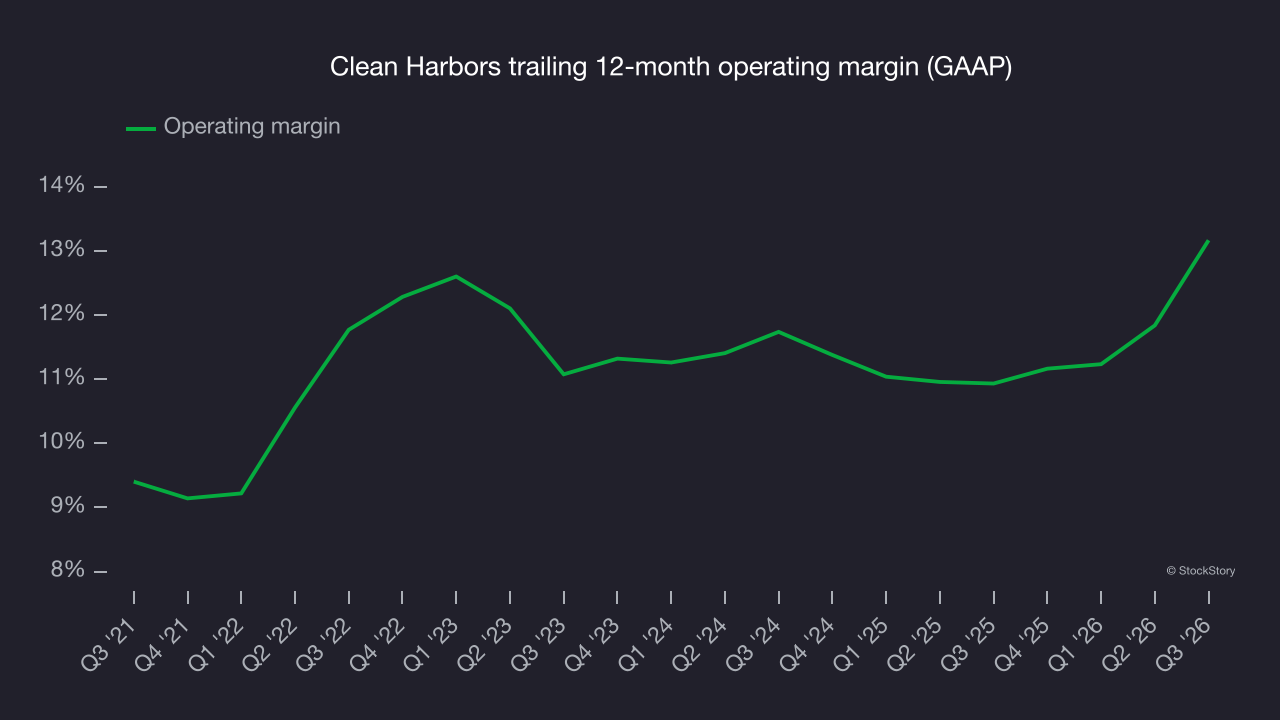
This quarter, Clean Harbors generated an operating margin of 17%, up 4.6 percentage points year on year. The increase was a positive sign. Operating margin rose more than gross margin, indicating greater efficiency in expenses such as marketing, R&D and administrative overhead.
Earnings per share
We track the long-term change in earnings per share (EPS) for the same reason as long-term revenue growth. Compared to revenue, however, EPS highlights whether a company’s growth is profitable.
Clean Harbors’s EPS grew at a 23.1% compounded annual growth rate over the last five years, higher than its 13.5% annualized revenue growth. This tells us the company became more profitable on a per-share basis as it expanded.
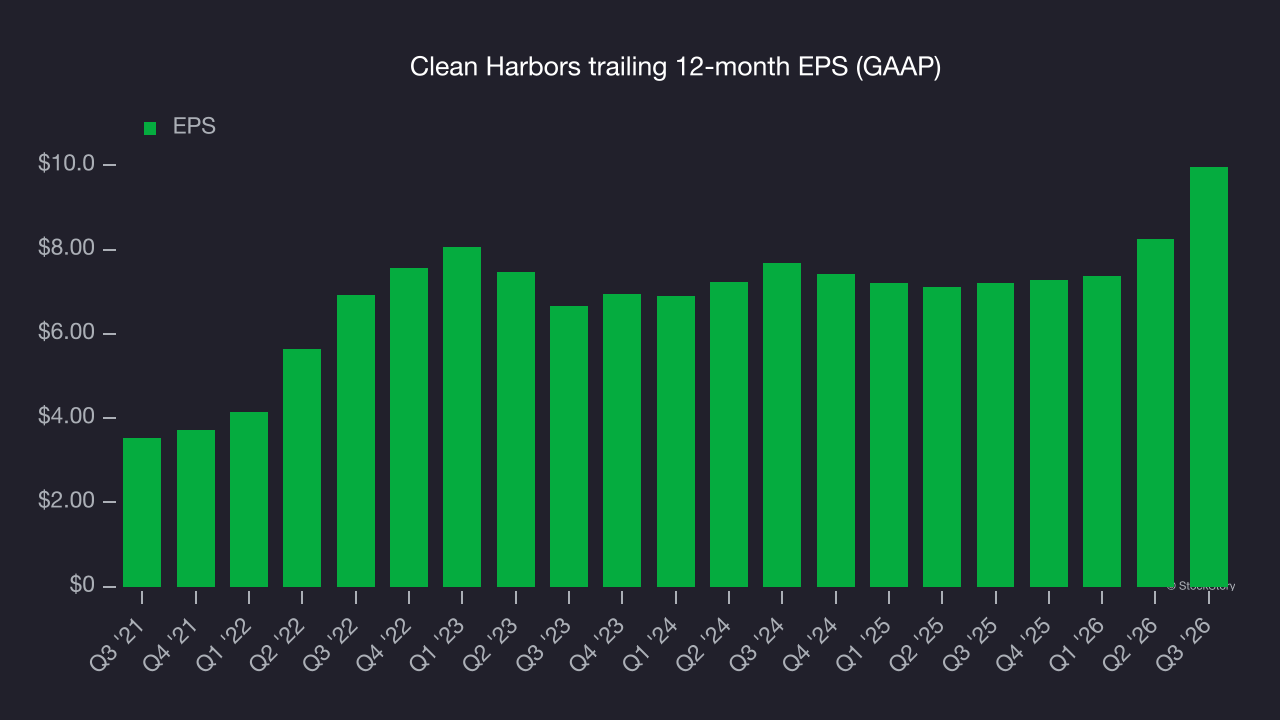
We can take a deeper look into Clean Harbors’s earnings to better understand the drivers of its performance. As we mentioned earlier, Clean Harbors’s operating margin expanded by 1.4 percentage points over the last five years. On top of that, its share count shrank by 3.3%. These are positive signs for shareholders because improving profitability and share buybacks boost EPS growth relative to revenue growth. 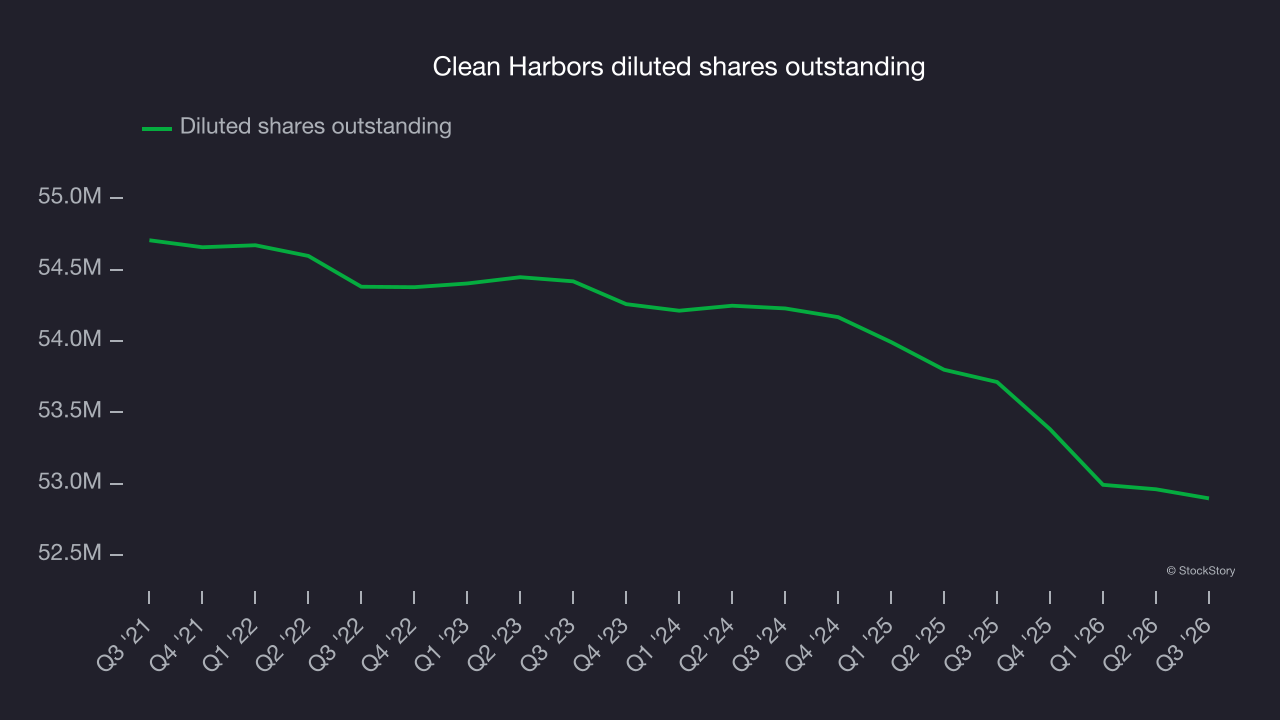
Like with revenue, we analyze EPS over a more recent period because it can provide insight into an emerging theme or development for the business.
For Clean Harbors, its two-year annual EPS growth of 13.9% was lower than its five-year trend. Still, its growth was good.
In Q3, Clean Harbors reported EPS of $3.93, up from $2.21 in the same quarter last year. EPS easily cleared analysts’ consensus estimates, a positive result for shareholders. Over the next 12 months, Wall Street expects Clean Harbors’s full-year EPS to grow 2% from $9.96 to $10.16, according to S&P.
Key takeaways from Clean Harbors’s Q3 results
Clean Harbors delivered a solid quarter, with EBITDA well above analysts’ consensus estimates and revenue also beating Wall Street’s consensus by a wide margin. Those were the key positives in the report. Shares rose 4.6% to $327.32 immediately after the release.
Clean Harbors had a solid quarterly earnings result, but is the stock a good investment? The latest quarter is only one piece of the longer-term business quality puzzle. Quality, when combined with valuation, can help determine if the stock is a buy. Read the full research report here for more on Clean Harbors (it’s free).