Freight transportation intermediary C.H. Robinson (NASDAQ: CHRW) announced better-than-expected revenue in Q3 2026, with revenue up 29.5% year on year to $5.36 billion. Its non-GAAP profit of $1.80 per share was 3% above analysts’ consensus estimates.
For more on C.H. Robinson Worldwide, read our free full research report.
C.H. Robinson Worldwide (CHRW) Q3 2026 highlights:
- Revenue $5.36 billion vs S&P analysts’ consensus estimates of $4.97 billion (29.5% year-on-year growth, 7.9% beat)
- Adjusted EPS $1.80 vs S&P analysts’ consensus estimates of $1.75 (3% beat)
- Operating margin 5.1%, in line with the same quarter last year
- Free cash flow margin 2.6%, down from 6.2% in the same quarter last year
- Market capitalization $16.58 billion
"I want to thank our people for continuing to provide exceptional service to our customers and carriers, embracing the Robinson operating model and executing with discipline, resulting in another quarter of double-digit year-over-year earnings growth," said President and Chief Executive Officer Dave Bozeman. "Our ability to consistently deliver secular earnings growth over the last three years is a result of the disciplined execution of our Lean AI strategy. Lean AI is our unique approach that combines the principles of our Robinson operating model – rooted in Lean methodology – with the power of custom-built AI, and the expertise of our people, to maximize value, minimize waste, and drive better outcomes for customers and carriers."
Revenue growth
A company’s long-term revenue performance can indicate its overall quality. Any business can experience short-term success, but top-performing ones sustain growth for years. C.H. Robinson Worldwide struggled to consistently generate demand over the last five years as its revenue dropped at a 2.9% annual rate. That underwhelming result points to a lack of business quality.
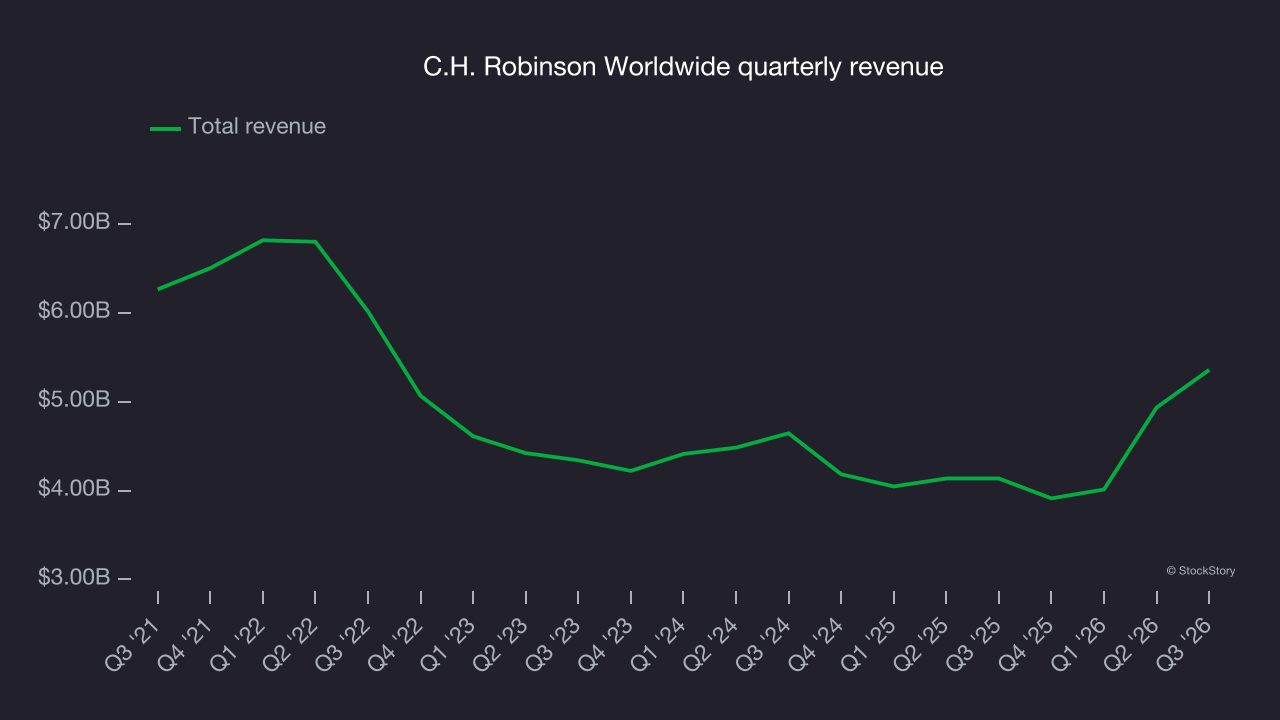
Long-term growth matters most, but within industrials, a half-decade historical view may miss new industry trends or demand cycles. C.H. Robinson Worldwide’s annualized revenue growth of 1.3% over the last two years is above its five-year trend, a positive sign. 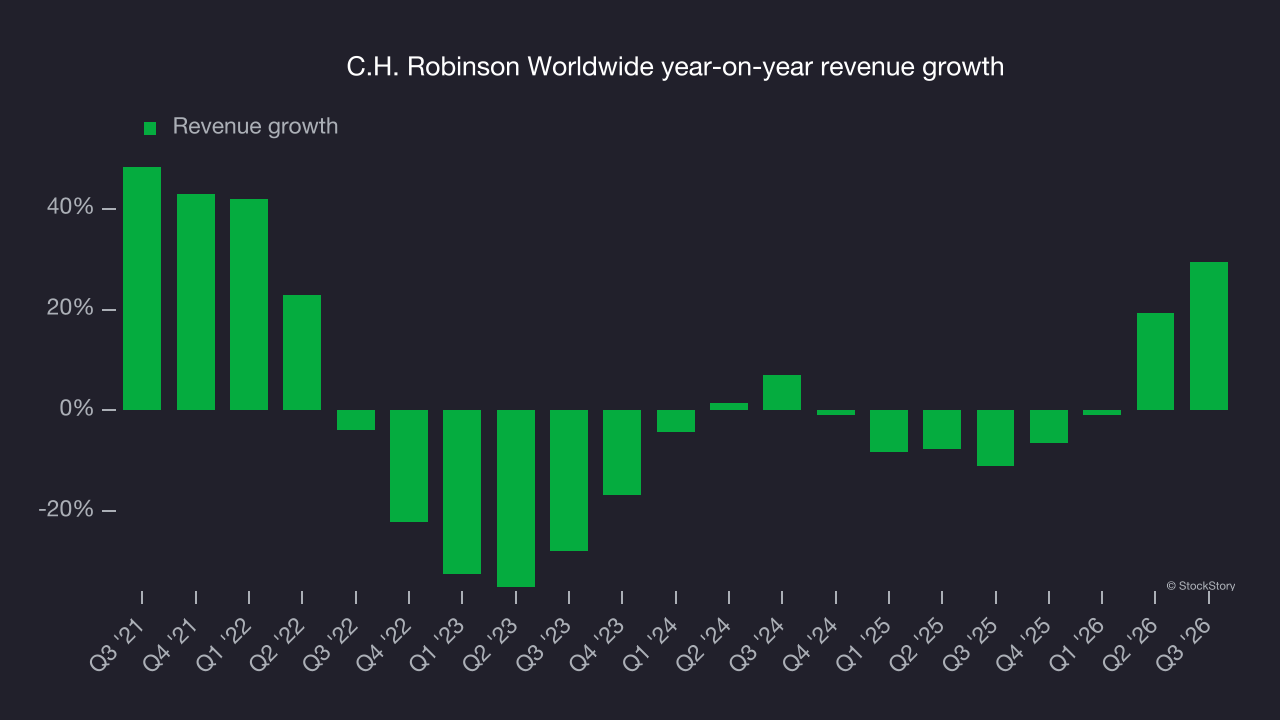
We can better understand the company’s revenue dynamics by analyzing its most important segments, North American surface transportation and Global Forwarding, which are 71.5% and 21.4% of revenue. Over the last two years, C.H. Robinson Worldwide’s North American surface transportation revenue (transportation brokerage) averaged 7.1% year-on-year growth. On the other hand, its Global Forwarding revenue (worldwide ocean, air, customers ) averaged 3.9% declines. 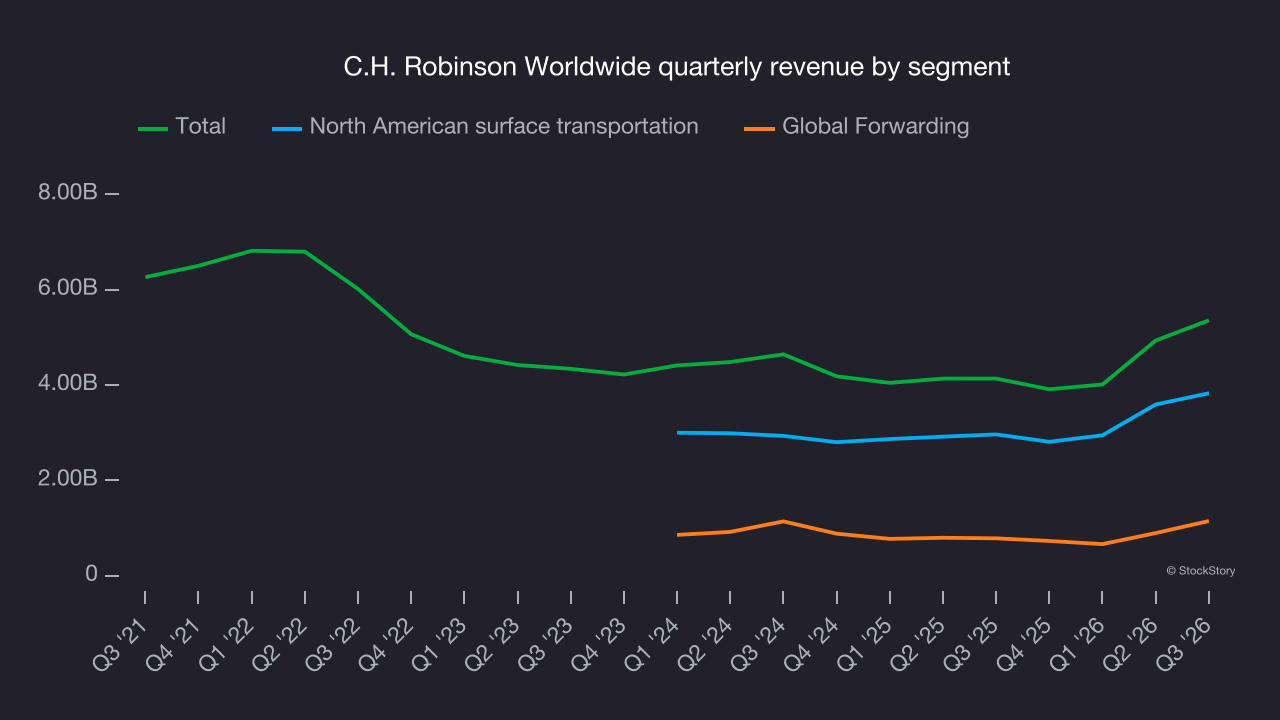
This quarter, C.H. Robinson Worldwide reported strong year-on-year revenue growth of 29.5%, and its $5.36 billion of revenue topped Wall Street’s consensus estimates by 7.9%.
Looking ahead, sell-side analysts expect revenue to grow 9% over the next 12 months, according to S&P, an improvement versus the last two years. This projection is above average for the sector and suggests its newer products and services will catalyze better top-line performance.
Operating margin
C.H. Robinson Worldwide’s operating margin has more or less stayed the same over the last 12 months, averaging 4.4% over the last five years. This profitability was poor for an industrials business, reflecting its suboptimal cost structure and low gross margin.
C.H. Robinson Worldwide’s operating margin may have fluctuated slightly but has generally stayed the same over the last five years, offering little sign of improvement.
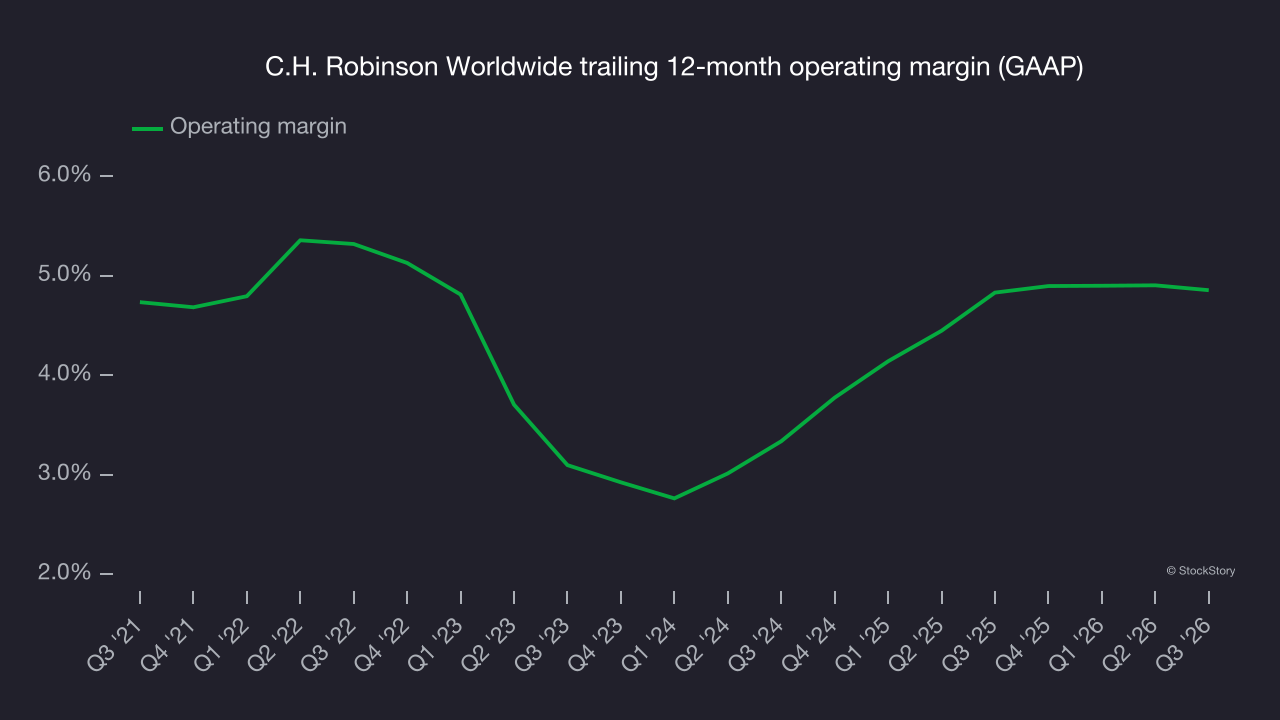
In Q3, C.H. Robinson Worldwide generated an operating margin of 5.1%, in line with the same quarter last year. This indicates the company’s cost structure has recently been stable.
Earnings per share
Revenue trends explain a company’s historical growth, but the long-term change in earnings per share (EPS) points to the profitability of that growth. For example, a company could inflate its revenue through excessive spending on advertising and promotions.
C.H. Robinson Worldwide’s EPS grew at a 1.2% compounded annual growth rate over the last five years. This performance was better than its 2.9% annualized revenue declines but doesn’t tell us much about its business quality because its operating margin didn’t improve.
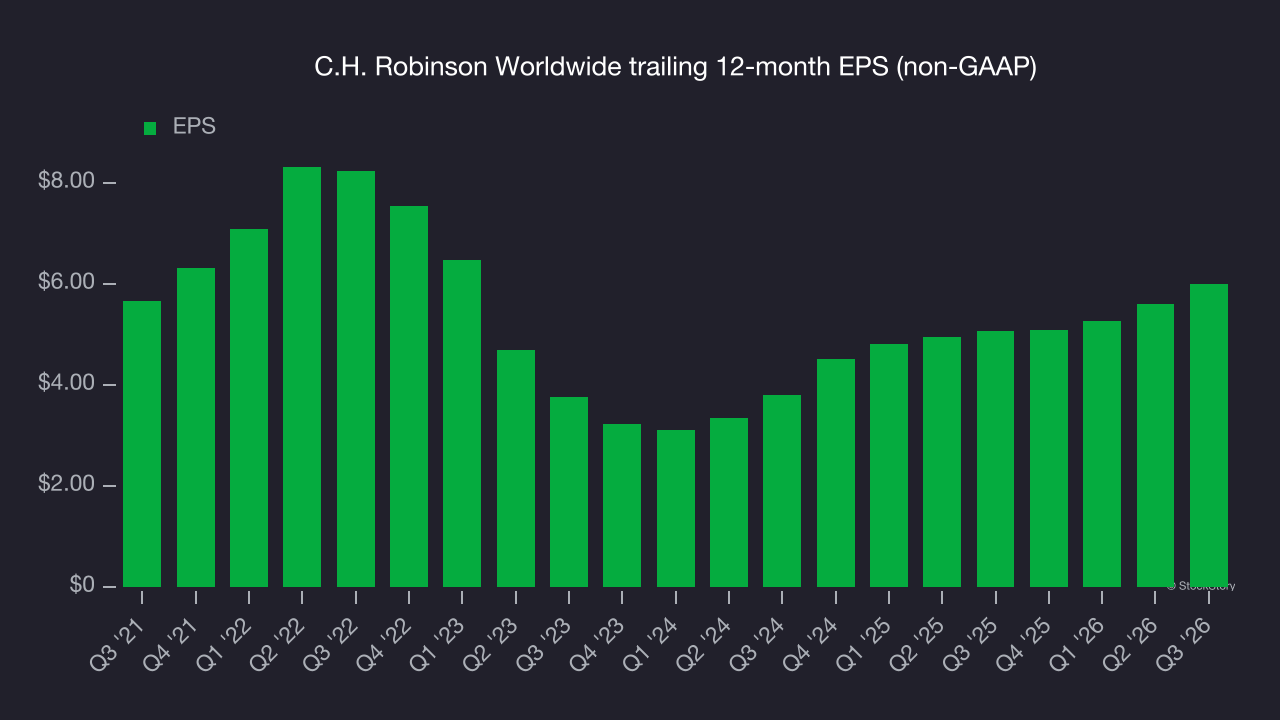
A closer look at C.H. Robinson Worldwide’s earnings helps explain the drivers of its performance. A five-year view shows that C.H. Robinson Worldwide has repurchased its stock, shrinking its share count by 11%. This indicates its EPS outperformed its revenue not because of increased operational efficiency but financial engineering, as buybacks boost per share earnings. 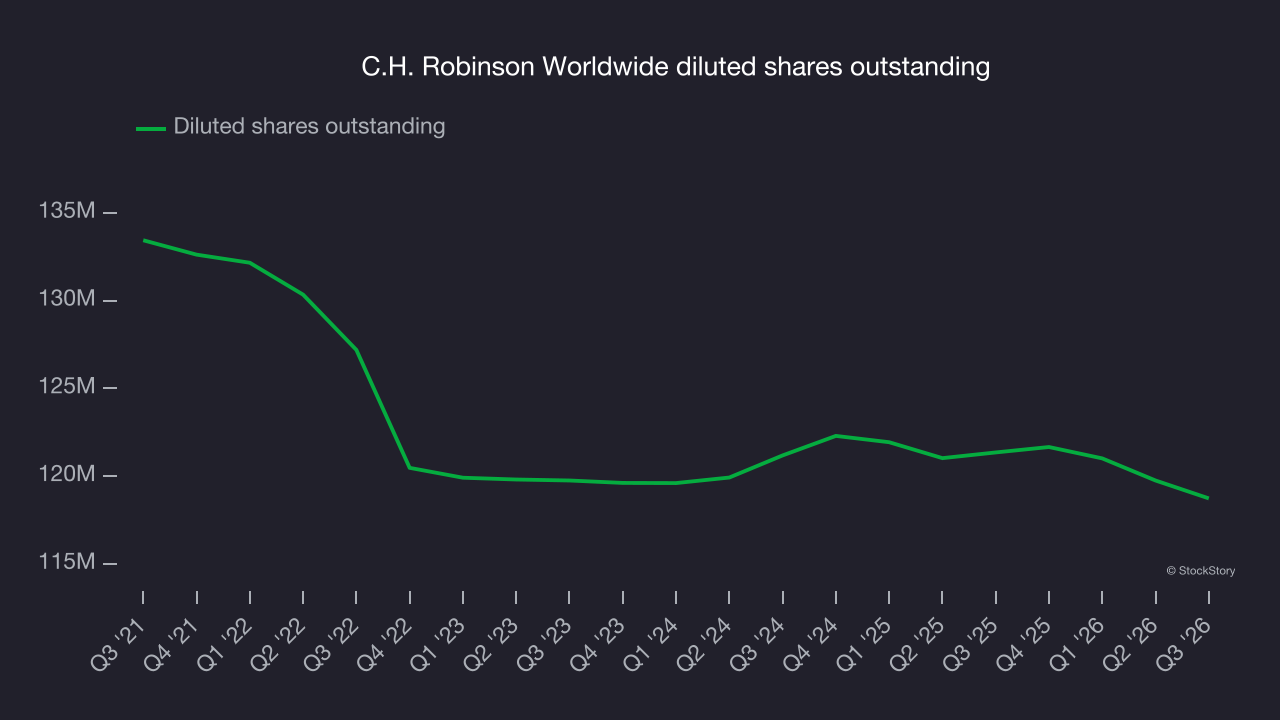
As with revenue, we analyze EPS over a more recent period because it can provide insight into an emerging theme or development for the business.
For C.H. Robinson Worldwide, its two-year annual EPS growth of 25.7% was higher than its five-year trend. This acceleration made it one of the faster-growing industrials companies in recent history.
In Q3, C.H. Robinson Worldwide reported adjusted EPS of $1.80, up from $1.40 in the same quarter last year. This result beat analysts’ consensus estimates by 3%. Over the next 12 months, Wall Street expects C.H. Robinson Worldwide’s full-year EPS to grow 22.4% from $5.99 to $7.33, according to S&P.
Key takeaways from C.H. Robinson Worldwide’s Q3 results
C.H. Robinson Worldwide delivered a solid quarter, led by revenue that came in well above analysts’ consensus estimates and EPS that also topped Wall Street’s expectations. Shares remained flat at $142.41 immediately after the results.
To assess C.H. Robinson Worldwide as an investment, consider its valuation, business quality and latest quarterly results. For more on these factors, read our full research report here (it’s free).