Industrial components supplier NN (NASDAQ: NNBR) reported revenue ahead of Wall Street’s expectations in Q3 2026, with revenue up 26.2% year on year to $131.1 million. The company’s full-year revenue guidance of $490 million at the midpoint came in 2.2% above analysts’ consensus estimates. Its non-GAAP profit of $0.07 per share was significantly above analysts’ consensus estimates.
For more on NN, read our free full research report.
NN (NNBR) Q3 2026 highlights:
- Revenue $131.1 million vs S&P analysts’ consensus estimates of $118.1 million (26.2% year-on-year growth, 11% beat)
- Adjusted EPS $0.07 vs S&P analysts’ consensus estimates of $0.01 (significant beat)
- Adjusted EBITDA $18.51 million vs analysts’ consensus estimates of $15.07 million (14.1% margin, 22.8% beat)
- Revenue guidance The company lifted its revenue guidance for the full year to $490 million at the midpoint from $465 million, a 5.4% increase
- EBITDA guidance $66 million at the midpoint for the full year, above analysts’ consensus estimates of $61.12 million
- Operating margin -2.5%, in line with the same quarter last year
- Free cash flow -$1.31 million, down from $7.74 million in the same quarter last year
- Market capitalization $329 million
Bevis continued, “Our 5 Pillar growth program is our touchstone. Now we are in a position to also explore logical, small bolt-on acquisitions to further enhance our goals and growth trajectory. We are pleased that many of our new sales programs require ‘Immediate Startup’. Overall, the new wins numbers are very good, but we have areas where we want a significantly higher level of wins and growth, especially Data Center, Medical, and Defense. We are disciplined about improving our margins at the same time, walking away from dilutive business, and exiting minimal margin, minimal ROI business. We believe we have more room to increase our gross margins, adjusted EBITDA margins, and ROIs.”
Revenue growth
A company’s long-term performance is an indicator of its overall quality. Any business can deliver a good quarter or two, but many enduring ones grow for years. NN struggled to consistently increase demand as its $483 million of revenue for the trailing 12 months was close to its revenue five years ago. That underwhelming result is a sign of poor business quality.
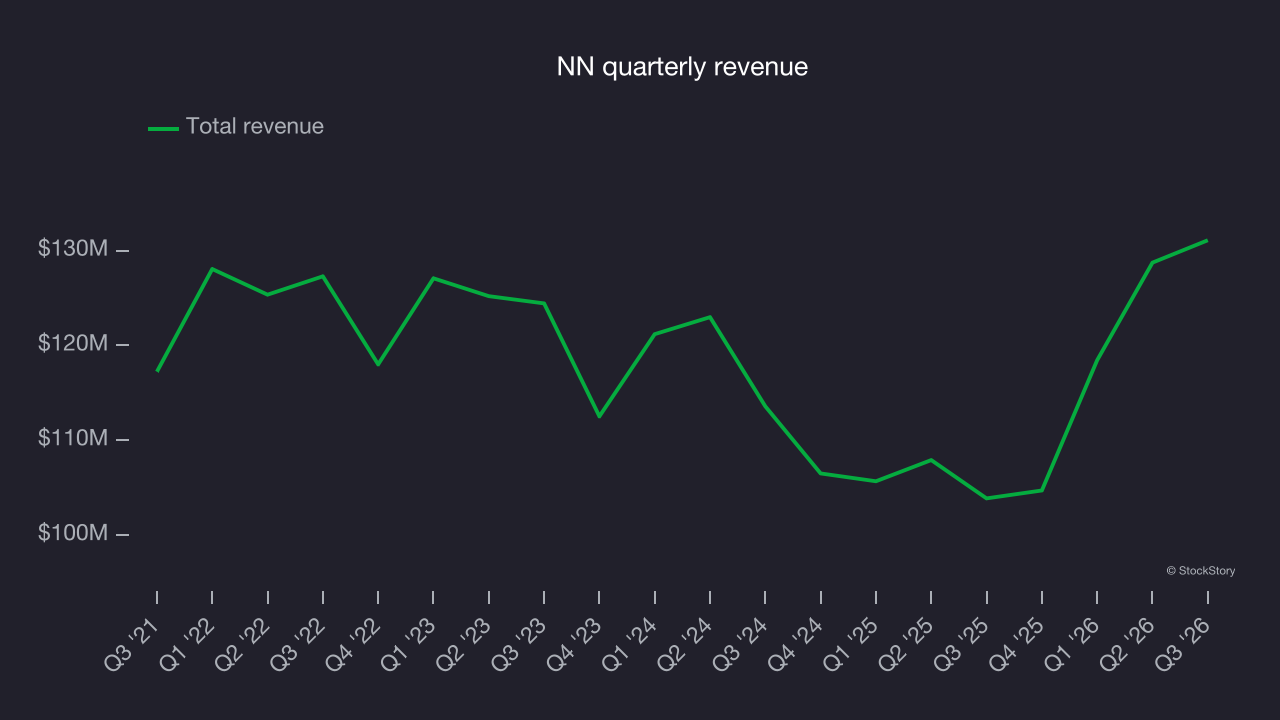
Long-term growth is the most important, but within industrials, a half-decade historical view may miss new industry trends or demand cycles. NN’s annualized revenue growth of 1.3% over the last two years is above its five-year trend, which is encouraging. 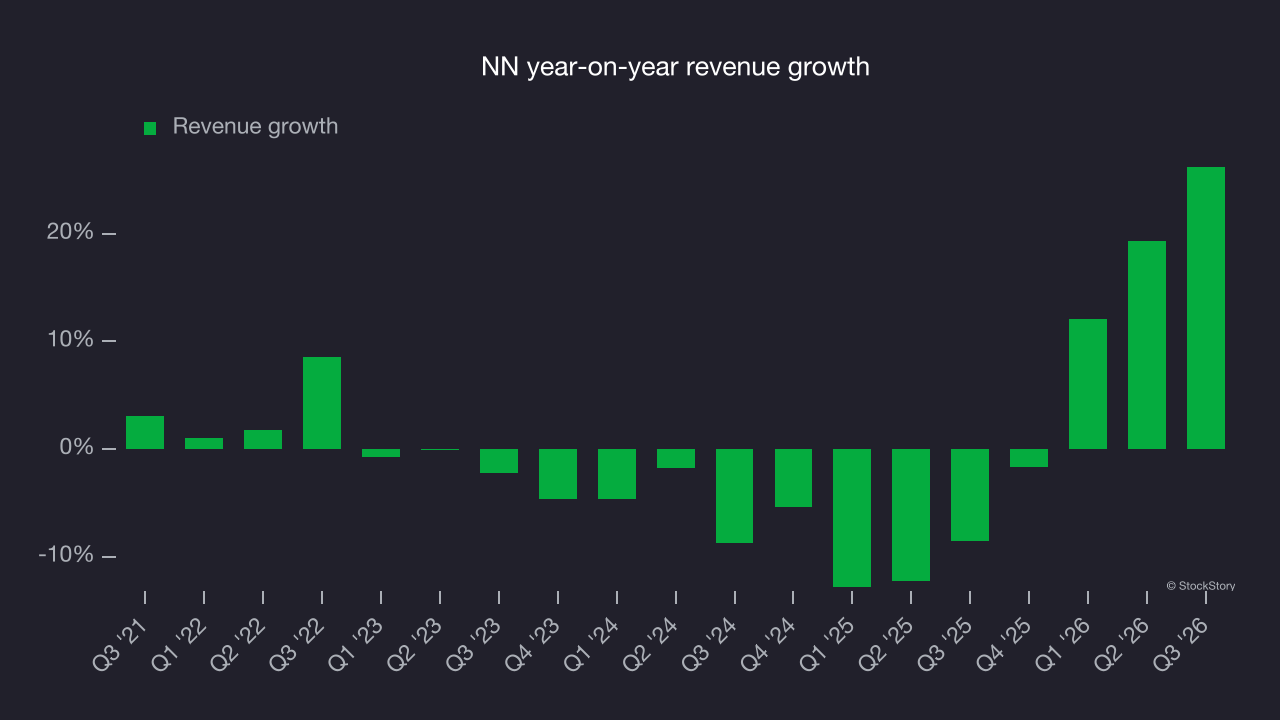
This quarter, NN reported strong year-on-year revenue growth of 26.2%, and its $131.1 million of revenue topped Wall Street’s consensus estimates by 11%.
Looking ahead, sell-side analysts expect revenue to grow 5.8% over the next 12 months, according to S&P. Although this projection indicates its newer products and services will fuel better top-line performance, it is still below average for the sector.
Operating margin
NN’s high expenses have contributed to an average operating margin of negative 4.7% over the last five years. Unprofitable industrials companies require extra attention because they may be vulnerable in a downturn. That raises doubts about whether the business can endure a full cycle.
On the positive side, NN’s operating margin rose by 1.5 percentage points over the last five years. Still, it will take much more for the company to reach long-term profitability.
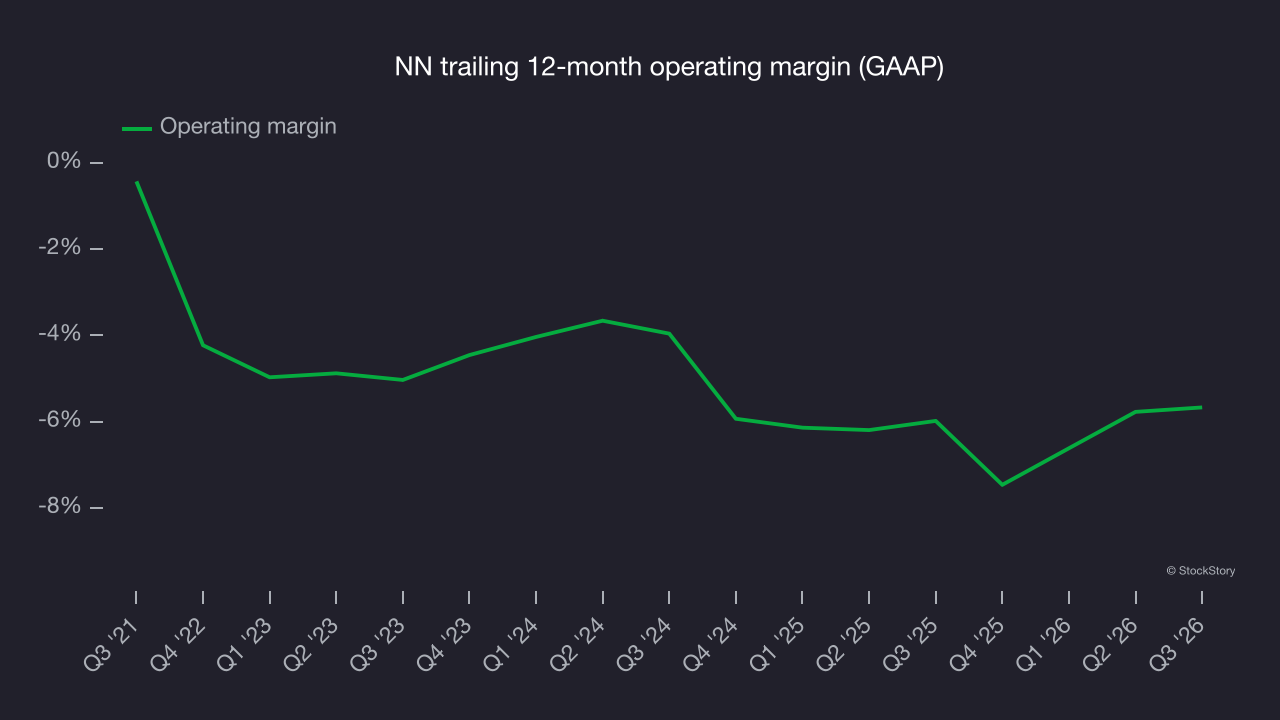
NN’s operating margin was negative 2.5% this quarter. The company’s consistent lack of profits is a concern.
Earnings per share
We track the long-term change in earnings per share (EPS) for the same reason as long-term revenue growth. Compared to revenue, however, EPS highlights whether a company’s growth is profitable.
NN’s EPS declined by 9.5% annually over the last five years while its revenue was flat. However, its operating margin improved during this time, indicating that non-fundamental factors such as interest expenses and taxes affected its ultimate earnings.
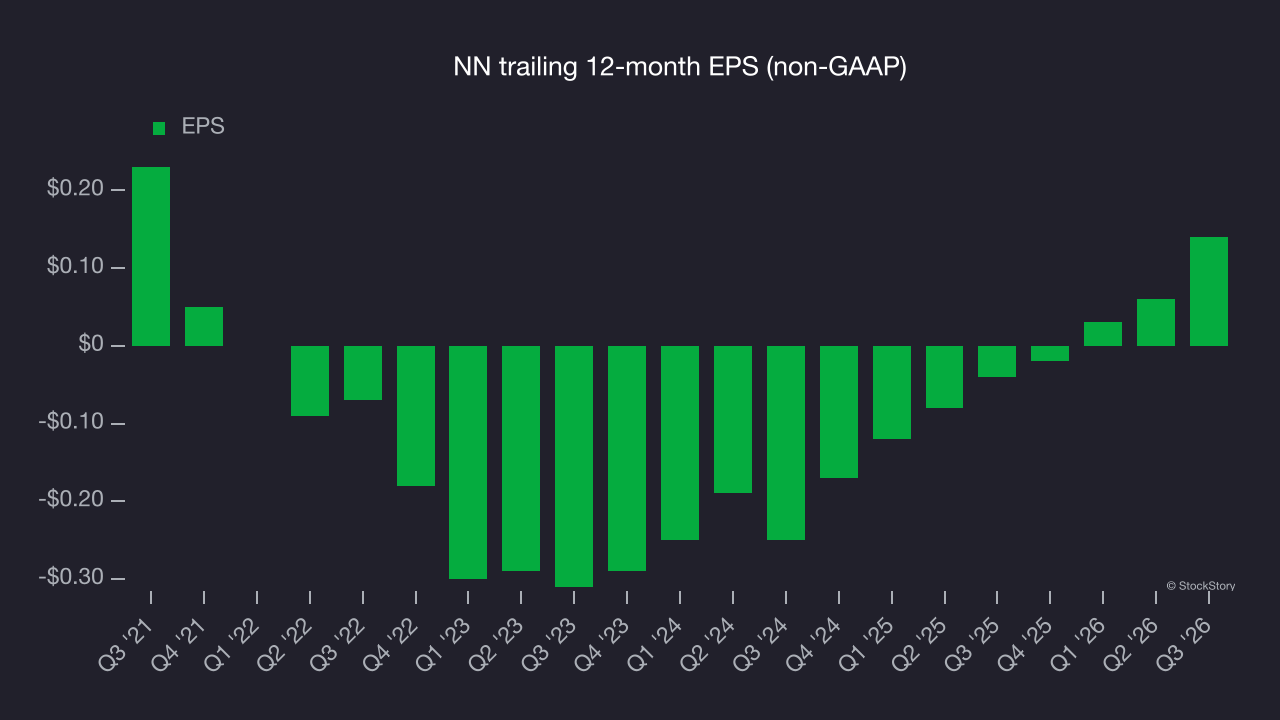
We can take a deeper look into NN’s earnings to better understand the drivers of its performance. A five-year view shows NN has diluted its shareholders, growing its share count by 75.7%. This dilution overshadowed its increased operational efficiency and has led to lower per share earnings. Taxes and interest expenses can also affect EPS but don’t tell us as much about a company’s fundamentals. 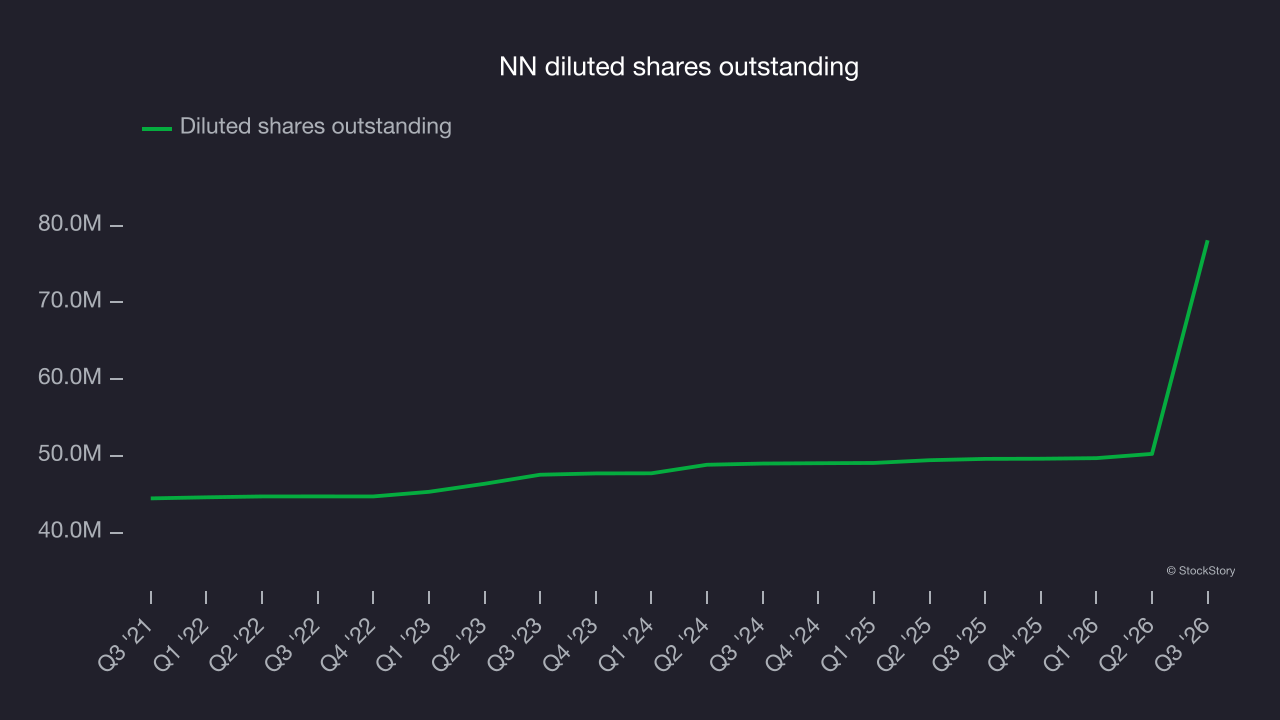
Like with revenue, we analyze EPS over a more recent period because it can provide insight into an emerging theme or development for the business.
For NN, its two-year annual EPS growth of 60% was higher than its five-year trend. This acceleration made it one of the faster-growing industrials companies in recent history.
In Q3, NN reported adjusted EPS of $0.07, up from negative $0.01 in the same quarter last year. This result came in well above analysts’ consensus estimates, a positive outcome for shareholders. Over the next 12 months, Wall Street expects NN’s full-year EPS to shrink by 2.4% from $0.14 to $0.14, according to S&P.
Key takeaways from NN’s Q3 results
NN’s wide EBITDA beat stood out among the quarter’s positives, and EPS also topped analysts’ consensus estimates. It was a solid quarter overall. Shares edged higher 1.5% to $3.86 immediately after the results.
NN may have had a good quarter, but that alone doesn’t make the stock a buy. The latest quarter matters, but longer-term business quality and valuation matter more when deciding whether to invest. For more on NN, read the full research report here (it’s free).