Hospitality and casino entertainment company MGM Resorts (NYSE: MGM) met Wall Street’s revenue expectations in Q3 2026, but revenue was flat year on year at $4.21 billion. Its non-GAAP loss of $0.11 per share was significantly below analysts’ consensus estimates.
For more on MGM Resorts, read our free full research report.
MGM Resorts (MGM) Q3 2026 highlights:
- Revenue $4.21 billion vs S&P analysts’ consensus estimates of $4.23 billion (flat year on year, in line)
- Adjusted EPS -$0.11 vs S&P analysts’ consensus estimates of $0.08 (significant miss)
- Adjusted EBITDA $402.8 million
- Operating margin 2.8%, up from -2.7% in the same quarter last year
- Market capitalization $7.04 billion
"MGM Resorts remains highly focused on the successful operations of our businesses. Our trailing twelve months Las Vegas Strip Resorts Segment Adjusted EBITDAR has grown by nearly 70% since calendar year 2019 and, while lower room rates during the third quarter impacted our results, October has rebounded favorably. Our diverse portfolio remains an advantage, with MGM China achieving 5% revenue growth and strong market share performance, while our digital businesses - including our BetMGM North America Venture and MGM Digital - reported strong topline growth during the third quarter," said Bill Hornbuckle, President & CEO of MGM Resorts International. "MGM Resorts remains dedicated to our mission to be the world's largest gaming and entertainment company with global integrated resorts, a leading digital presence, and, notably, an enviable growth pipeline with MGM Osaka to drive future value."
Revenue growth
A company’s long-term revenue performance is one signal of its overall quality. Any business can experience short-term success, but top-performing ones sustain growth for years. Over the last five years, MGM Resorts grew its revenue at a 16.9% annual rate. Though this growth is acceptable on an absolute basis, revenue growth alone is not enough in the consumer discretionary sector, which can display significant earnings volatility. The bar for the sector is particularly high, reflecting the non-essential and hit-driven nature of the products and services offered. Additionally, the five-year CAGR starts around Covid, when revenue was depressed before rebounding.
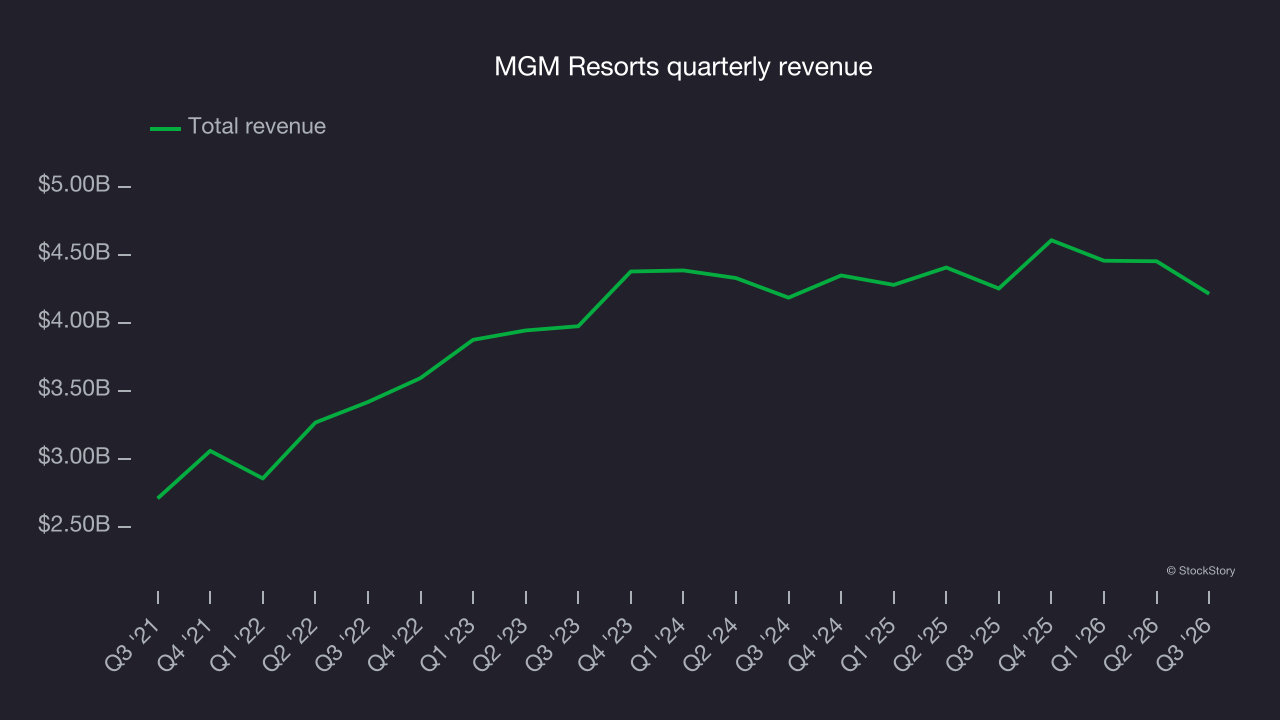
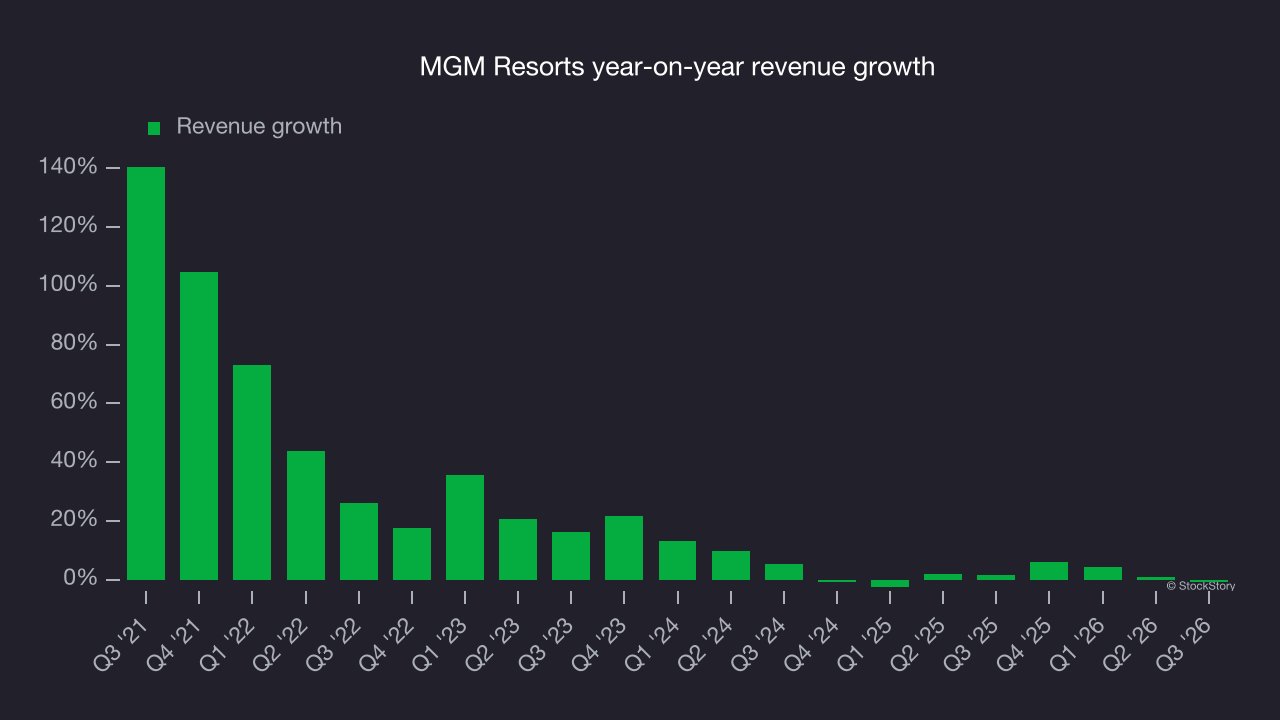
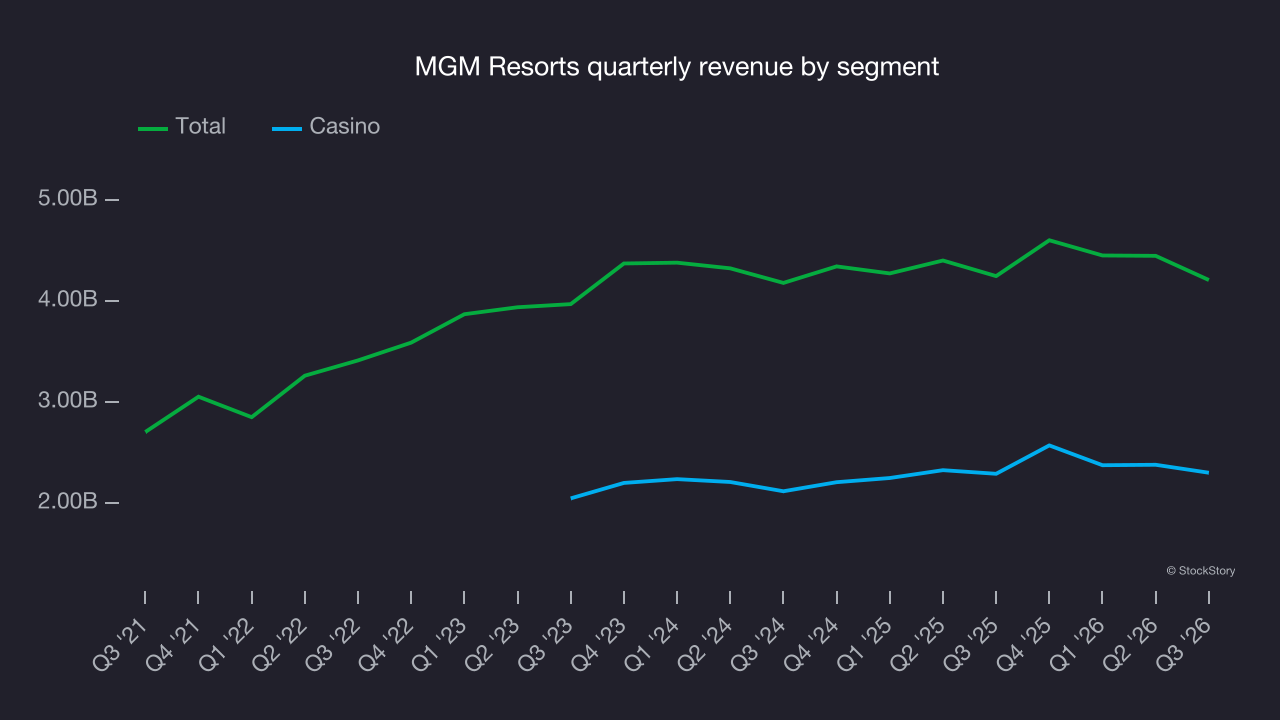
This quarter, MGM Resorts’s $4.21 billion of revenue was flat year on year and in line with Wall Street’s consensus estimates.
Looking ahead, sell-side analysts expect revenue to decline by 2.7% over the next 12 months, according to S&P, a deceleration versus the last two years. That underwhelming outlook suggests its products and services will face some demand challenges.
Operating margin
MGM Resorts’s operating margin has been trending up over the last 12 months and averaged 6.3% over the last two years. The company’s improved efficiency is a positive, but its suboptimal cost structure means profitability remains inadequate for a consumer discretionary business.
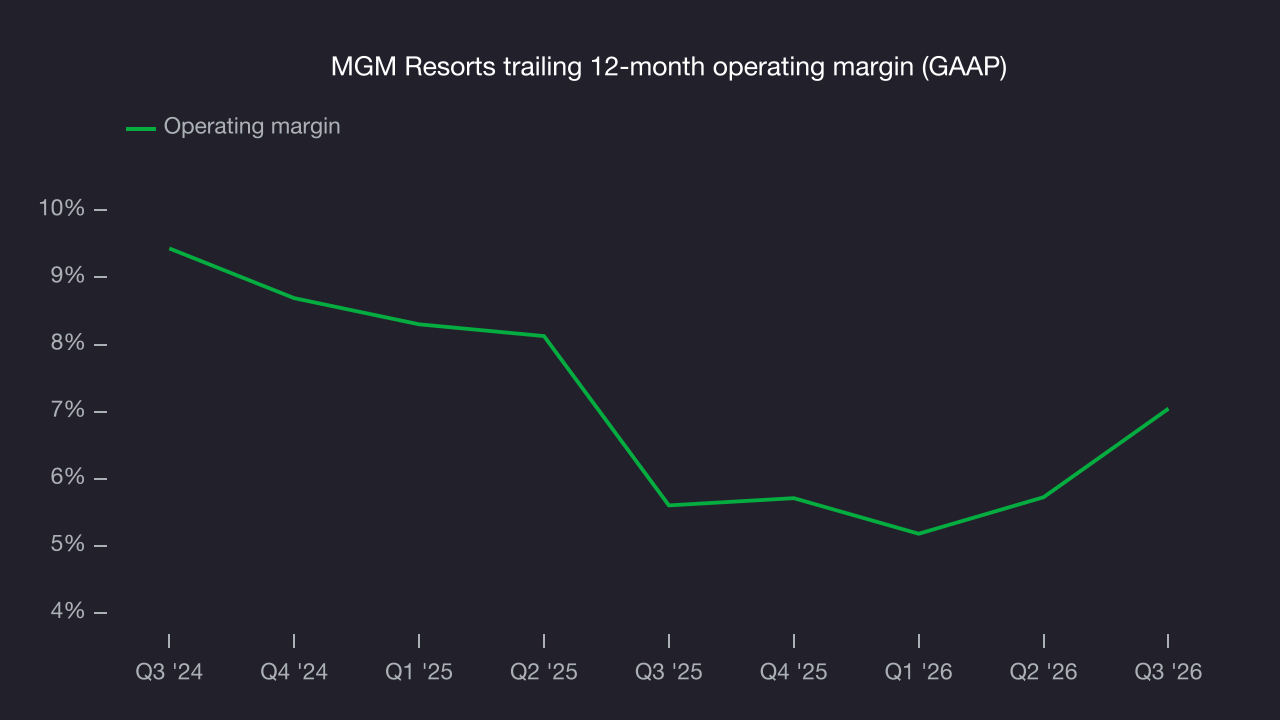
In Q3, MGM Resorts generated an operating margin of 2.8%, up 5.5 percentage points year on year. This increase was a positive development, reflecting improved efficiency.
Earnings per share
We track the long-term change in earnings per share (EPS) for the same reason as long-term revenue growth. Compared to revenue, however, EPS highlights whether a company’s growth is profitable.
MGM Resorts’s full-year EPS turned positive after being negative five years ago. That improvement marks a critical turning point for the company.
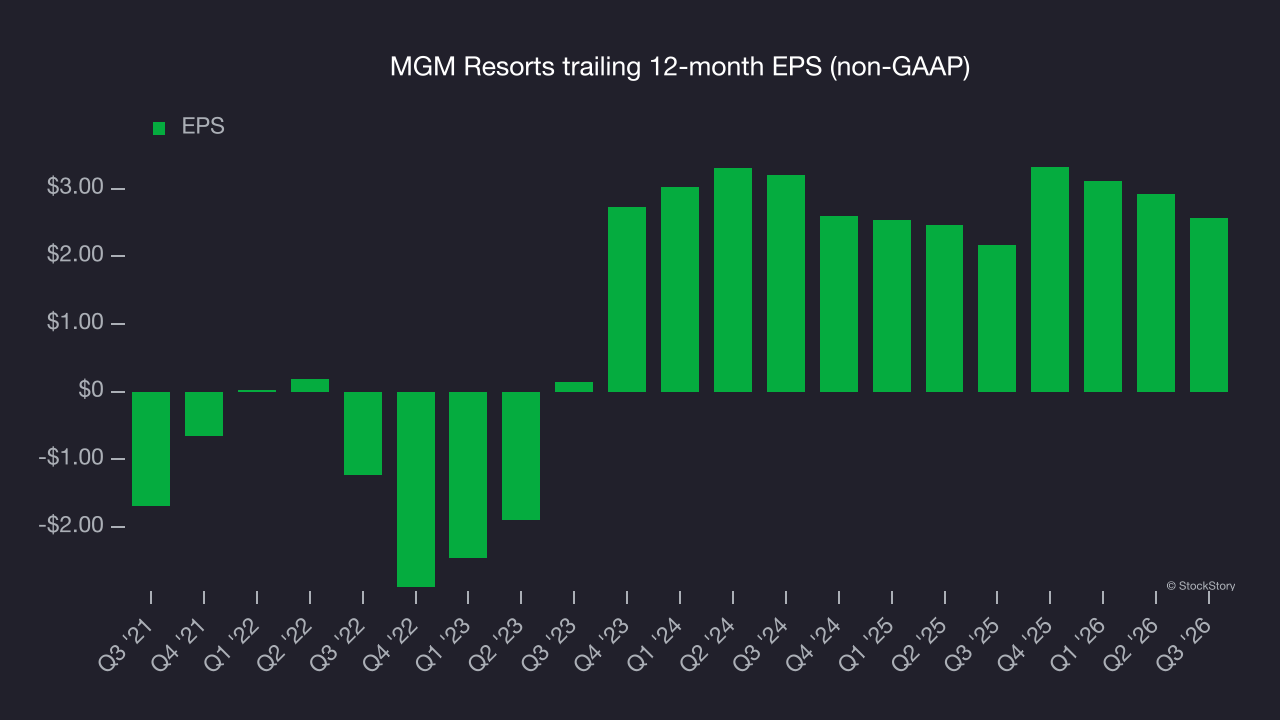
In Q3, MGM Resorts reported adjusted EPS of negative $0.11, down from $0.24 in the same quarter last year. This result missed analysts’ consensus estimates. Over the next 12 months, Wall Street expects MGM Resorts’s full-year EPS to shrink by 47.2% from $2.57 to $1.36, according to S&P.
Key takeaways from MGM Resorts’s Q3 results
MGM Resorts delivered a weaker quarter with few positives: EBITDA and EPS both fell short of Wall Street’s consensus estimates. Shares edged lower 1.3% to $26.91 immediately after the results.
MGM Resorts’s earnings report left more to be desired. The question is whether this quarter has created a buying opportunity. That decision requires a broader look at valuation and business quality alongside the latest earnings. For more on MGM Resorts, read our full research report here (it’s free).