Freight transportation company Union Pacific (NYSE: UNP) reported revenue ahead of Wall Street’s expectations in Q3 2026, with sales up 15.3% year on year to $7.2 billion. Its non-GAAP profit of $3.53 per share was 1.6% above analysts’ consensus estimates.
Is now the time to buy Union Pacific? Find out by accessing our full research report, it’s free.
Union Pacific (UNP) Q3 2026 highlights:
- Revenue: $7.2 billion vs analyst estimates of $7.14 billion (15.3% year-on-year growth, 0.8% beat)
- Adjusted EPS: $3.53 vs analyst estimates of $3.48 (1.6% beat)
- Operating Margin: 40.9%, in line with the same quarter last year
- Free Cash Flow Margin: 59.6%, up from 12% in the same quarter last year
- Market Capitalization: $171 billion
"Union Pacific's third quarter results demonstrate our ability to safely deliver the service we sold to our customers while efficiently handling six percent volume growth," said Jim Vena, Union Pacific Chief Executive Officer. "We executed at a consistently high level, enabling record financial results and further reinforcing our position as the industry leader. We look forward to the upcoming steps of the Surface Transportation Board's merger review process and to delivering the benefits of America's first transcontinental railroad for our customers."
Company overview
Part of the transcontinental railroad project, Union Pacific (NYSE: UNP) is a freight transportation company that operates a major railroad network.
Revenue growth
A company’s long-term performance is an indicator of its overall quality. Any business can experience short-term success, but top-performing ones enjoy sustained growth for years. Regrettably, Union Pacific’s sales grew at a sluggish 4.4% compounded annual growth rate over the last five years. This fell short of our benchmark for the industrials sector and is a tough starting point for our analysis.
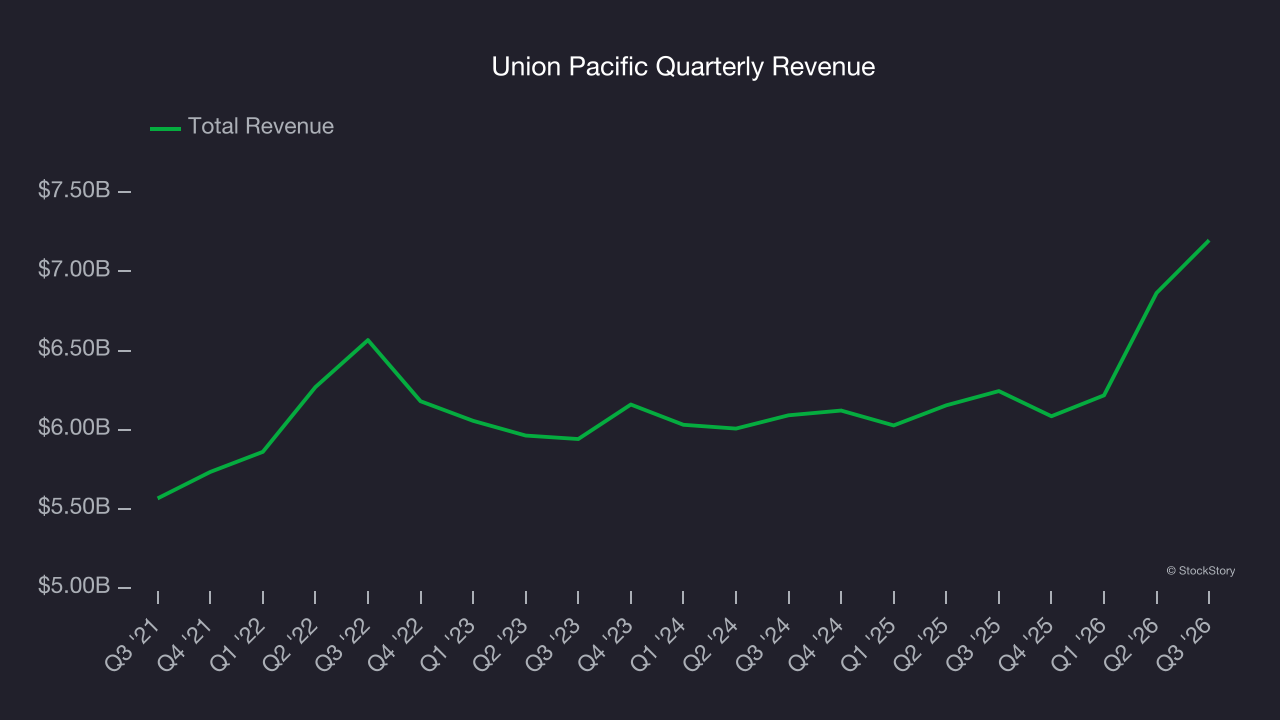
Long-term growth is the most important, but within industrials, a half-decade historical view may miss new industry trends or demand cycles. Union Pacific’s annualized revenue growth of 4.2% over the last two years aligns with its five-year trend, suggesting its demand was consistently weak. 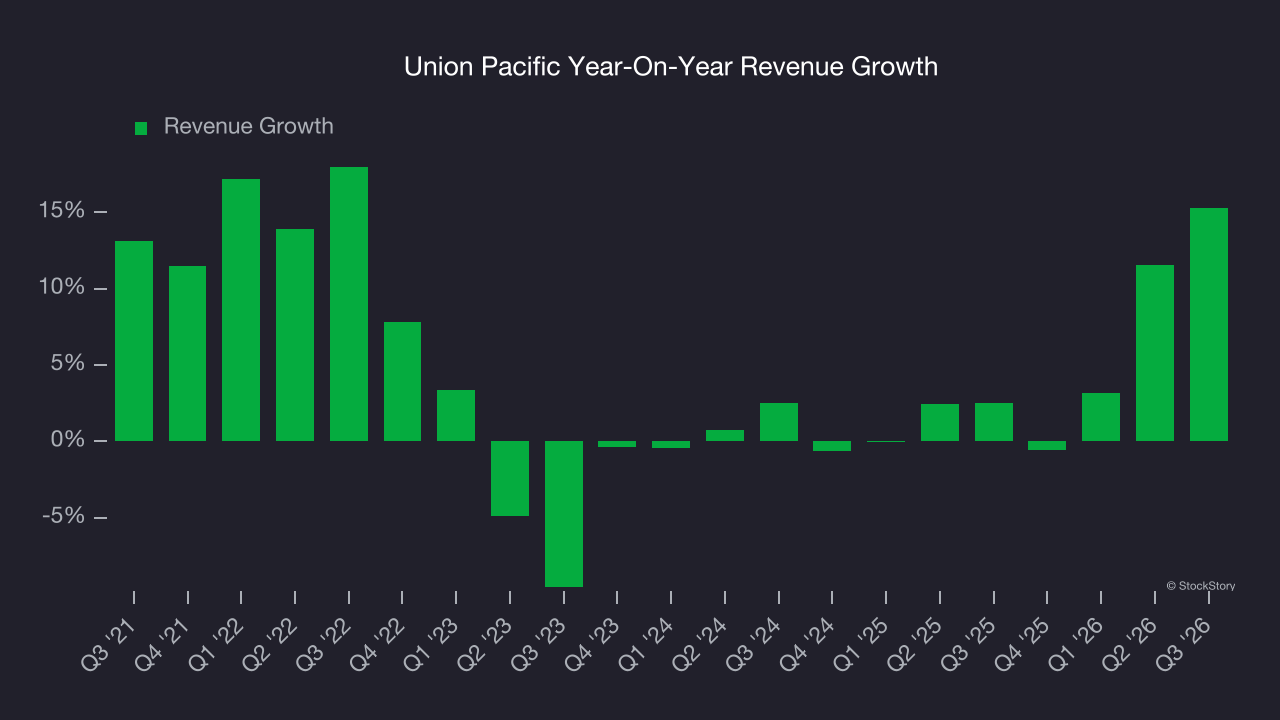
This quarter, Union Pacific reported year-on-year revenue growth of 15.3%, and its $7.2 billion of revenue exceeded Wall Street’s estimates by 0.8%.
Looking ahead, sell-side analysts expect revenue to grow 7.5% over the next 12 months. Although this projection indicates its newer products and services will catalyze better top-line performance, it is still below the sector average.
ALSO WORTH WATCHING: Nvidia’s Quiet Partner. Nvidia’s chips cost a hundred grand. The connectors that make them work cost even more. One company makes them all.
Every AI server needs specialized infrastructure the chip companies don’t make. High-speed cables. Power connectors. Thermal sensors. This 90-year-old company built a monopoly on it. The AI boom just started. This stock is still flying under the radar. Claim The Stock Ticker Here for FREE.
Operating margin
Union Pacific’s operating margin has more or less stayed the same over the last 12 months , averaging 39.7% over the last five years. This profitability was elite for an industrials business thanks to its efficient cost structure and economies of scale. This result isn’t surprising as its high gross margin gives it a favorable starting point.
Looking at the trend in its profitability, Union Pacific’s operating margin might have fluctuated slightly but has generally stayed the same over the last five years. We like to see margin expansion, but we’re still happy with Union Pacific’s performance considering most rail transportation companies saw their margins plummet.
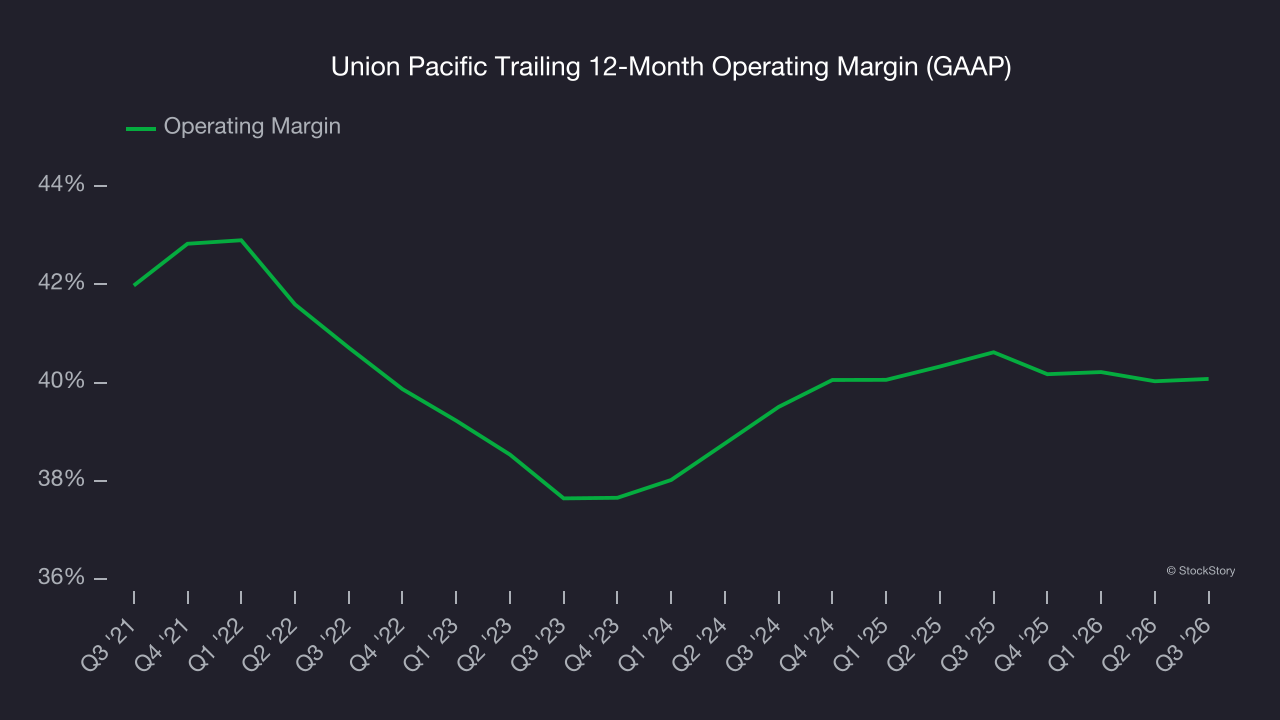
This quarter, Union Pacific generated an operating margin profit margin of 40.9%, in line with the same quarter last year. This indicates the company’s cost structure has recently been stable.
Earnings per share
Revenue trends explain a company’s historical growth, but the long-term change in earnings per share (EPS) points to the profitability of that growth — for example, a company could inflate its sales through excessive spending on advertising and promotions.
Union Pacific’s unimpressive 5.7% annual EPS growth over the last five years aligns with its revenue performance. This tells us it maintained its per-share profitability as it expanded.
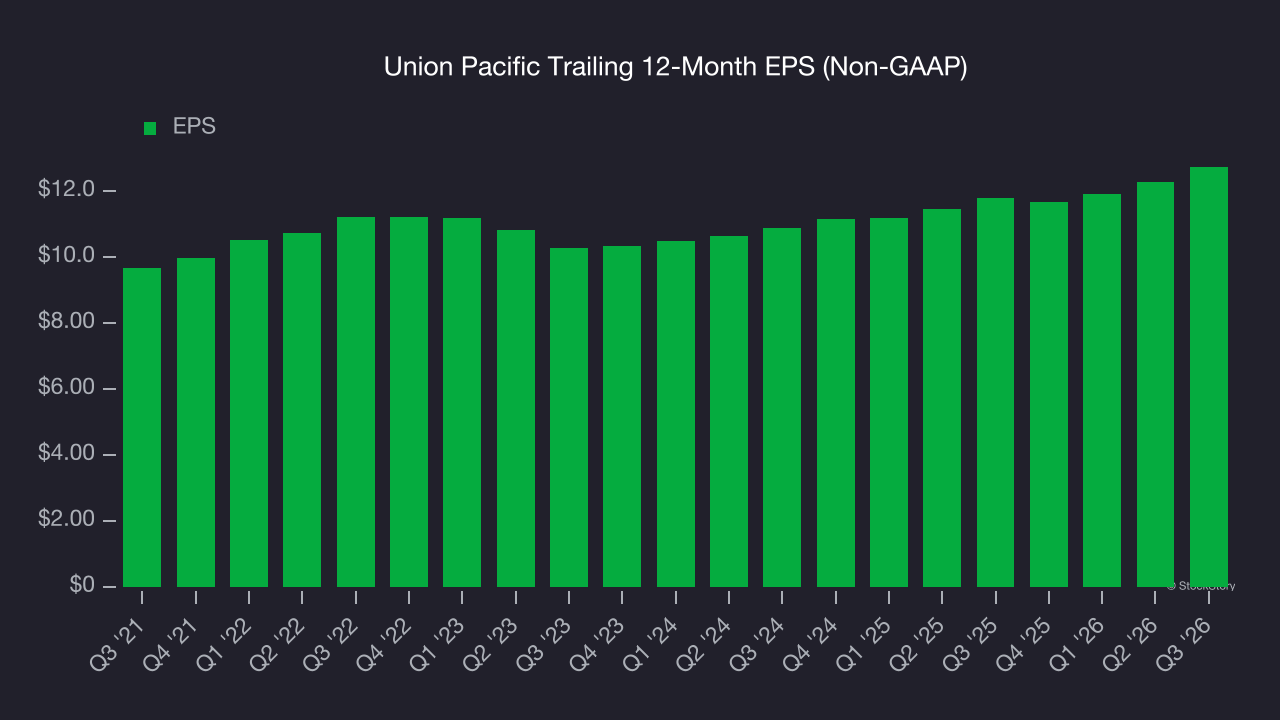
Like with revenue, we analyze EPS over a more recent period because it can provide insight into an emerging theme or development for the business.
Union Pacific’s two-year annual EPS growth of 8.1% was decent and topped its 4.2% two-year revenue growth.
Diving into the nuances of Union Pacific’s earnings can give us a better understanding of its performance. While we mentioned earlier that Union Pacific’s operating margin was flat this quarter, a two-year view shows its margin has expandedwhile its share count has shrunk 2.3%. Improving profitability and share buybacks are positive signs for shareholders as they juice EPS growth relative to revenue growth. 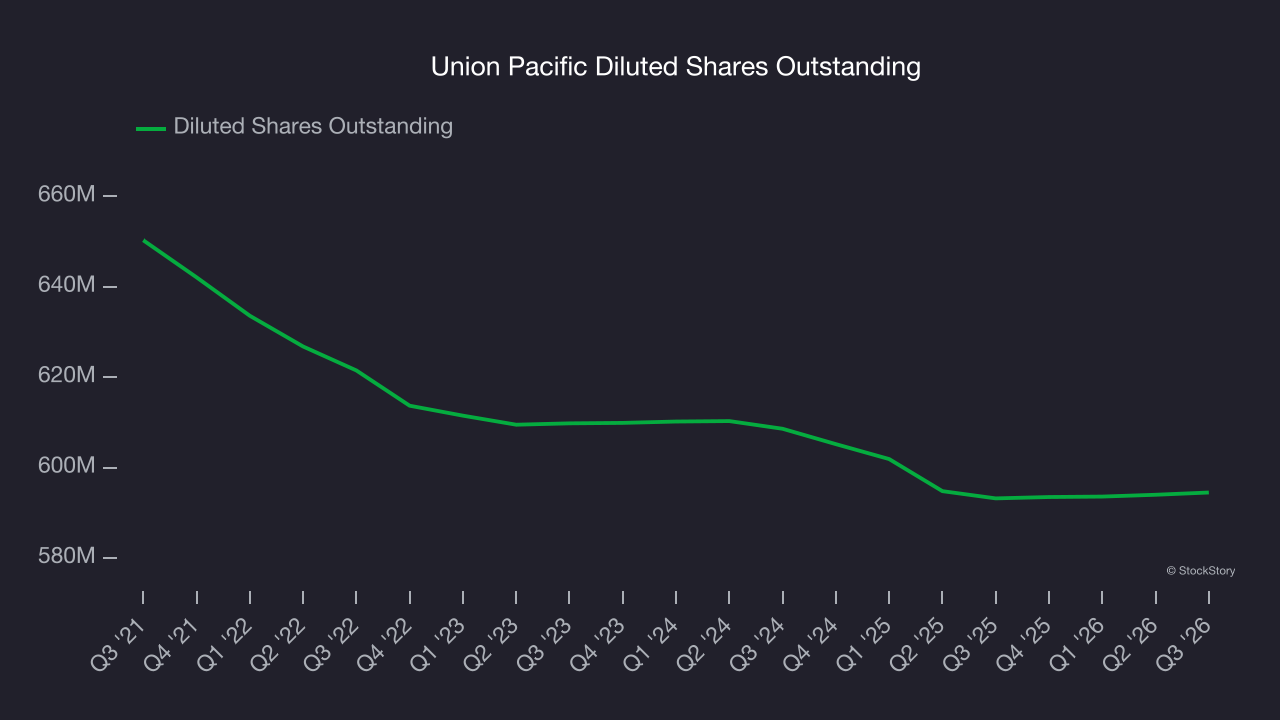
In Q3, Union Pacific reported adjusted EPS of $3.53, up from $3.08 in the same quarter last year. This print beat analysts’ estimates by 1.6%. Over the next 12 months, Wall Street expects Union Pacific’s full-year EPS to grow 9.5% from $12.73 to $13.93.
Key takeaways from Union Pacific’s Q3 results
It was good to see Union Pacific narrowly top analysts’ revenue expectations this quarter. Overall, this print had some key positives. The market seemed to be hoping for more, and the stock traded down 2.7% to $280.09 immediately after reporting.
Big picture, is Union Pacific a buy here and now? When making that decision, it’s important to consider its valuation, business qualities, as well as what has happened in the latest quarter. We cover that in our actionable full research report which you can read here (it’s free).