Regional banking company S&T Bancorp (NASDAQ: STBA) reported Q3 2026 results exceeding the market’s revenue expectations, with sales up 4% year on year to $107.8 million. Its GAAP profit of $1.09 per share was 10.6% above analysts’ consensus estimates.
Is now the time to buy S&T Bancorp? Find out by accessing our full research report, it’s free.
S&T Bancorp (STBA) Q3 2026 highlights:
- Net Interest Income: $93.13 million vs analyst estimates of $92.26 million (4.4% year-on-year growth, 0.9% beat)
- Net Interest Margin: 4.1% vs analyst estimates of 4% (8.5 basis point beat)
- Revenue: $107.8 million vs analyst estimates of $106.9 million (4% year-on-year growth, 0.8% beat)
- Efficiency Ratio: 53.2% vs analyst estimates of 54.9% (168.2 basis point beat)
- EPS (GAAP): $1.09 vs analyst estimates of $0.99 (10.6% beat)
- Tangible Book Value per Share: $29.28 vs analyst estimates of $29.54 (2.1% year-on-year growth, 0.9% miss)
- Market Capitalization: $1.72 billion
"Our results reflect another strong quarter, highlighted by record earnings per share, record revenue and higher core profitability," said Chris McComish, chief executive officer. "We delivered broad-based strength across our income statement which reflects our disciplined operating strategy and continued focus on creating shareholder value. We believe we are well-positioned to build on this momentum and capitalize on future opportunities."
Company overview
Tracing its roots back to 1902 in western Pennsylvania's industrial heartland, S&T Bancorp (NASDAQ: STBA) is a Pennsylvania-based bank holding company that provides retail and commercial banking services, cash management, trust services, and investment advisory solutions.
Sales growth
Net interest income and fee-based revenue are the two pillars supporting bank earnings. The former captures profit from the gap between lending rates and deposit costs, while the latter encompasses charges for banking services, credit products, wealth management, and trading activities. Regrettably, S&T Bancorp’s revenue grew at a sluggish 4.2% compounded annual growth rate over the last five years. This fell short of our benchmark for the banking sector and is a poor baseline for our analysis.
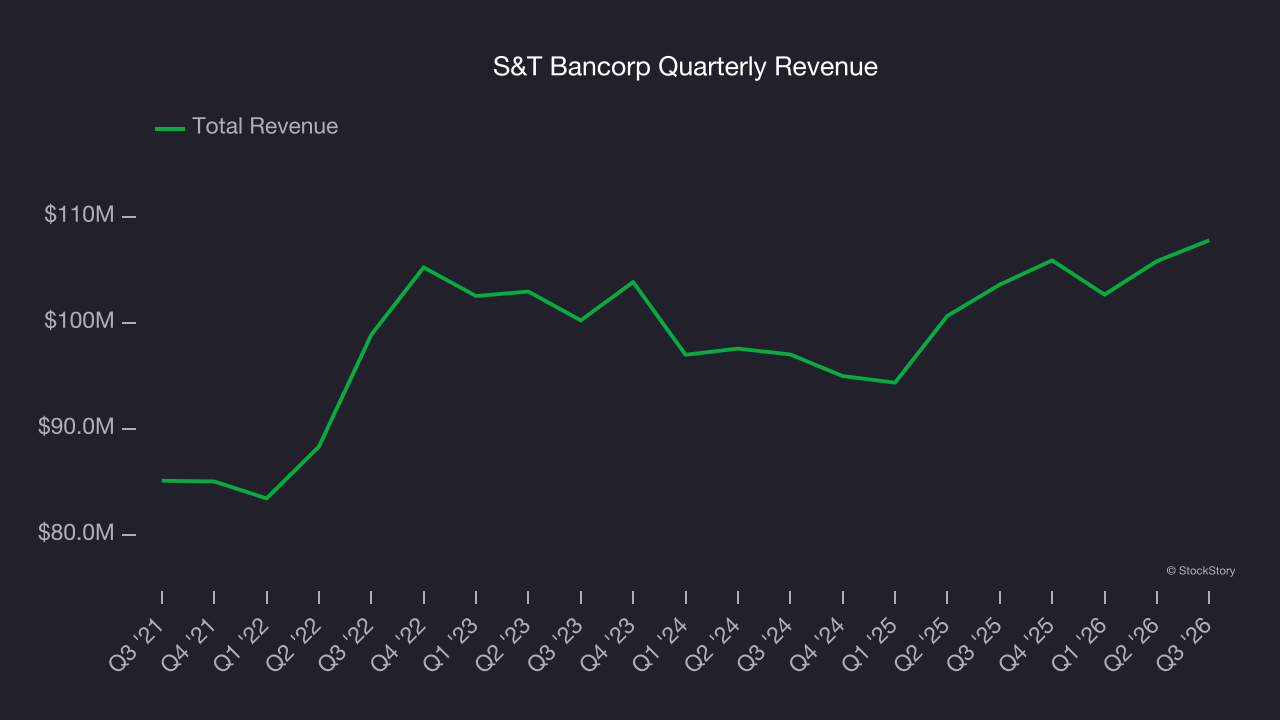
Long-term growth is the most important, but within financials, a half-decade historical view may miss recent interest rate changes and market returns. S&T Bancorp’s annualized revenue growth of 3.3% over the last two years aligns with its five-year trend, suggesting its demand was consistently weak. 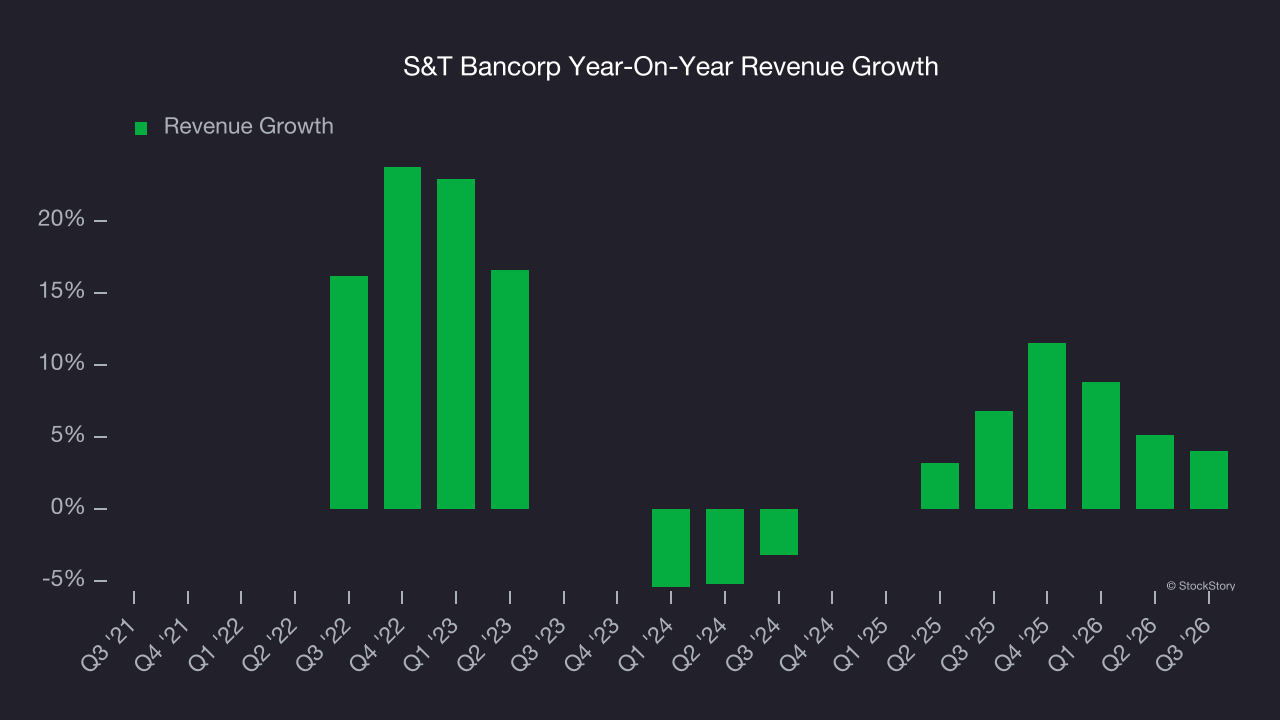 Note: Quarters not shown were determined to be outliers because they were impacted by outsized investment gains/losses that are not indicative of the recurring fundamentals of the business.
This quarter, S&T Bancorp reported modest year-on-year revenue growth of 4% but beat Wall Street’s estimates by 0.8%.
Net interest income made up 87.6% of the company’s total revenue during the last five years, meaning S&T Bancorp barely relies on non-interest income to drive its overall growth.
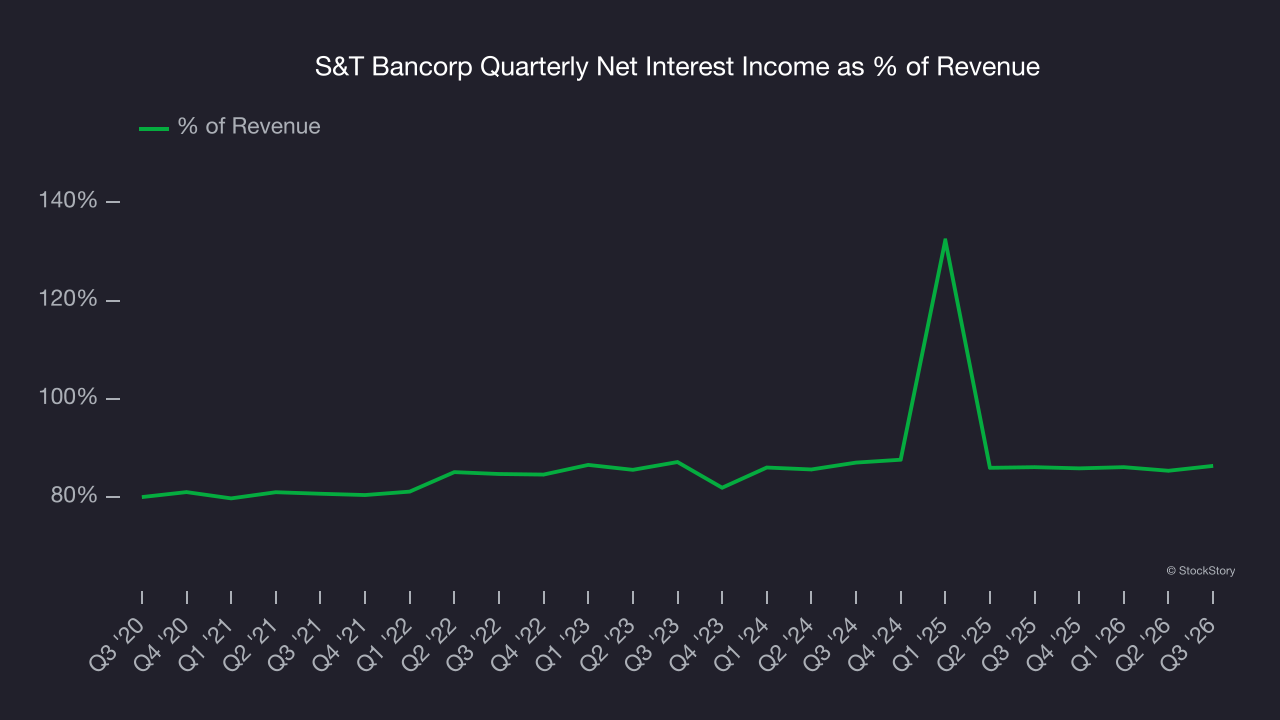
Markets consistently prioritize net interest income growth over fee-based revenue, recognizing its superior quality and recurring nature compared to the more unpredictable non-interest income streams.
ALSO WORTH WATCHING: Nvidia’s Quiet Partner. Nvidia’s chips cost a hundred grand. The connectors that make them work cost even more. One company makes them all.
Every AI server needs specialized infrastructure the chip companies don’t make. High-speed cables. Power connectors. Thermal sensors. This 90-year-old company built a monopoly on it. The AI boom just started. This stock is still flying under the radar. Claim The Stock Ticker Here for FREE.
Tangible book value per share (TBVPS)
Banks operate as balance sheet businesses, with profits generated through borrowing and lending activities. Valuations reflect this reality, emphasizing balance sheet strength and long-term book value compounding ability.
When analyzing banks, tangible book value per share (TBVPS) takes precedence over many other metrics. This measure isolates genuine per-share value by removing intangible assets of debatable liquidation worth. Other (and more commonly known) per-share metrics like EPS can sometimes be murky due to M&A or accounting rules allowing for loan losses to be spread out.
S&T Bancorp’s TBVPS grew at an impressive 7% annual clip over the last five years. However, TBVPS growth has recently decelerated a bit to 5.9% annual growth over the last two years (from $26.12 to $29.28 per share).
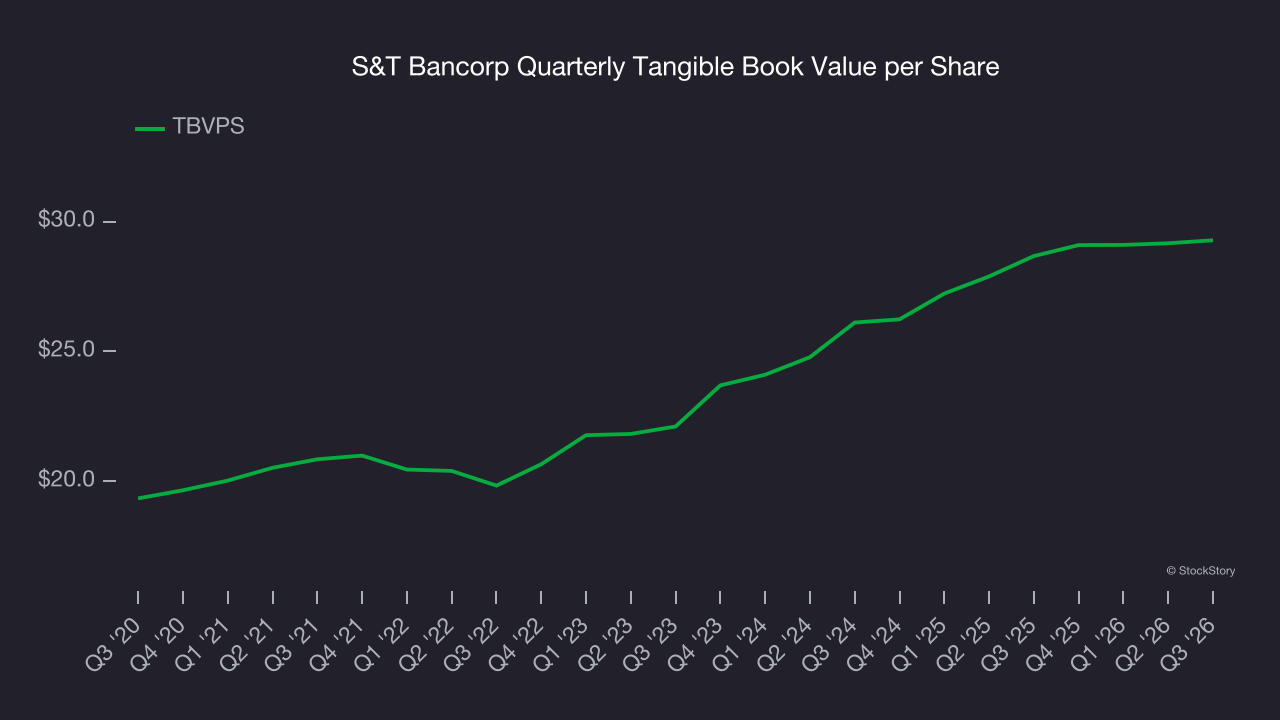
Over the next 12 months, Consensus estimates call for S&T Bancorp’s TBVPS to grow by 8.9% to $31.89, paltry growth rate.
Key takeaways from S&T Bancorp’s Q3 results
It was good to see S&T Bancorp beat analysts’ EPS expectations this quarter. We were also happy its net interest income narrowly outperformed Wall Street’s estimates. On the other hand, its tangible book value per share slightly missed. Overall, this print had some key positives. The stock remained flat at $48.86 immediately following the results.
Is S&T Bancorp an attractive investment opportunity right now? What happened in the latest quarter matters, but not as much as longer-term business quality and valuation, when deciding whether to invest in this stock. We cover that in our actionable full research report which you can read here (it’s free).