
Regional banking company Flagstar Financial (NYSE: FLG) fell short of the market’s revenue expectations in Q2 CY2026 as sales rose 4% year on year to $516 million. Its non-GAAP profit of $0.05 per share was $0.02 below analysts’ consensus estimates.
Is now the time to buy Flagstar Financial? Find out by accessing our full research report, it’s free.
Flagstar Financial (FLG) Q2 CY2026 Highlights:
- Net Interest Income: $440 million vs analyst estimates of $465 million (5% year-on-year growth, 5.4% miss)
- Net Interest Margin: 2.1% vs analyst estimates of 2.2% (10.2 basis point miss)
- Revenue: $516 million vs analyst estimates of $543.6 million (4% year-on-year growth, 5.1% miss)
- Efficiency Ratio: 87.1% vs analyst estimates of 82.2% (484.2 basis point miss)
- Adjusted EPS: $0.05 vs analyst estimates of $0.07 ($0.02 miss)
- Tangible Book Value per Share: $17.51 vs analyst estimates of $17.34 (1.6% year-on-year growth, 1% beat)
- Market Capitalization: $6.13 billion
Commenting on the Bank's second quarter 2026 performance, Executive Chairman and Chief Executive Officer, Joseph M. Otting stated, "Flagstar's second quarter operating performance reflects our third consecutive quarter of profitability and improved earnings and represents continued progress on our path to transforming into a top-performing regional bank. During the quarter, we made considerable strides diversifying our balance sheet, reaching an important inflection point in asset growth, as total assets increased 3% on an annualized basis compared to the first quarter, driven by overall growth in our loan portfolio.
Company Overview
Tracing its roots back to 1859 and rebranded from New York Community Bancorp in 2024, Flagstar Financial (NYSE: FLG) is a bank holding company that offers commercial and consumer banking services, with specialties in multi-family lending, mortgage originations, and warehouse lending.
Sales Growth
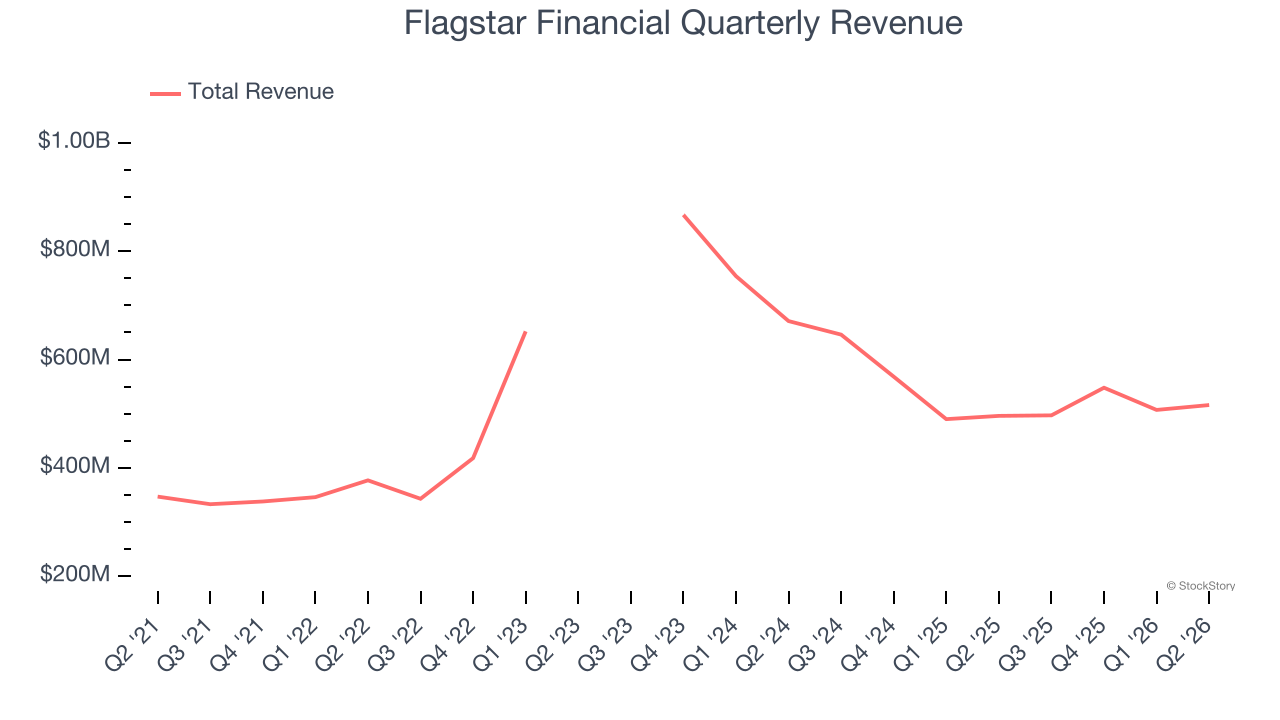
Two primary revenue streams drive bank earnings. While net interest income, which is earned by charging higher rates on loans than paid on deposits, forms the foundation, fee-based services across banking, credit, wealth management, and trading operations provide additional income. Unfortunately, Flagstar Financial’s 10% annualized revenue growth over the last five years was mediocre. This was below our standard for the banking sector and is a rough starting point for our analysis.
 Note: Quarters not shown were determined to be outliers because they were impacted by outsized investment gains/losses that are not indicative of the recurring fundamentals of the business.
Long-term growth is the most important, but within financials, a half-decade historical view may miss recent interest rate changes and market returns. Flagstar Financial’s performance shows it grew in the past but relinquished its gains over the last two years, as its revenue fell by 21.2% annually. 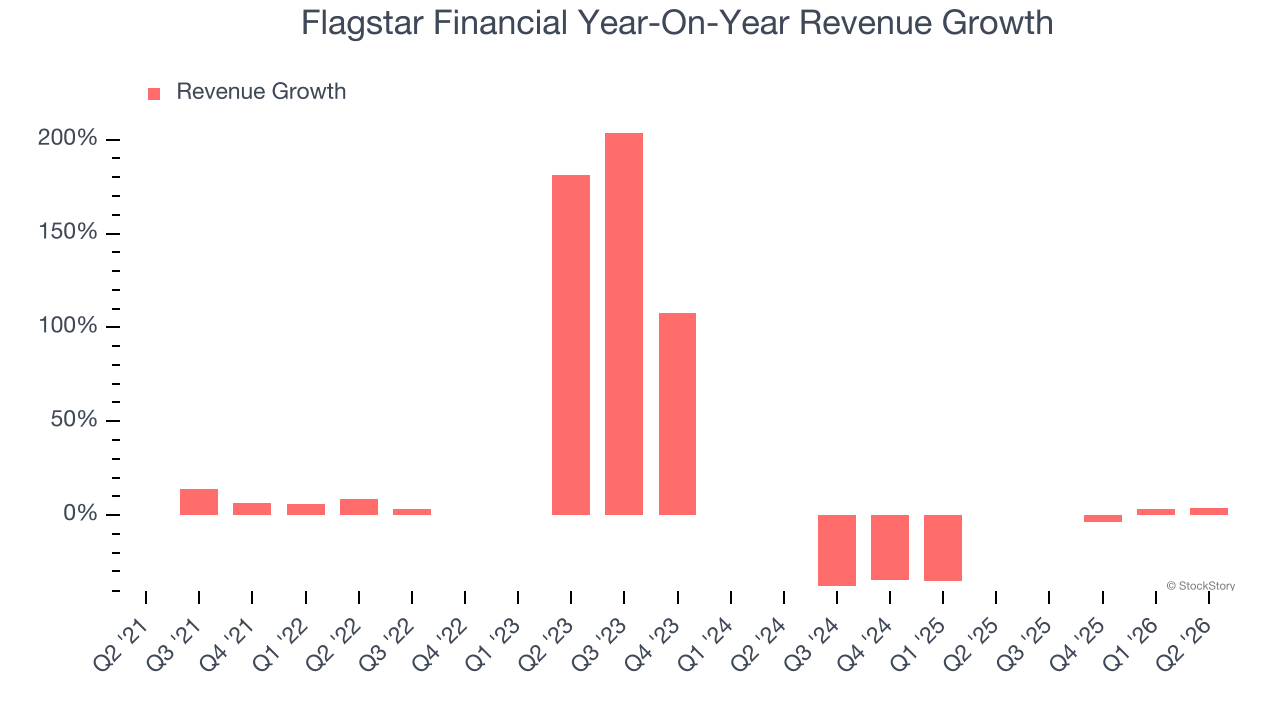 Note: Quarters not shown were determined to be outliers because they were impacted by outsized investment gains/losses that are not indicative of the recurring fundamentals of the business.
This quarter, Flagstar Financial’s revenue grew by 4% year on year to $516 million, falling short of Wall Street’s estimates.
Net interest income made up 87.2% of the company’s total revenue during the last five years, meaning Flagstar Financial barely relies on non-interest income to drive its overall growth.
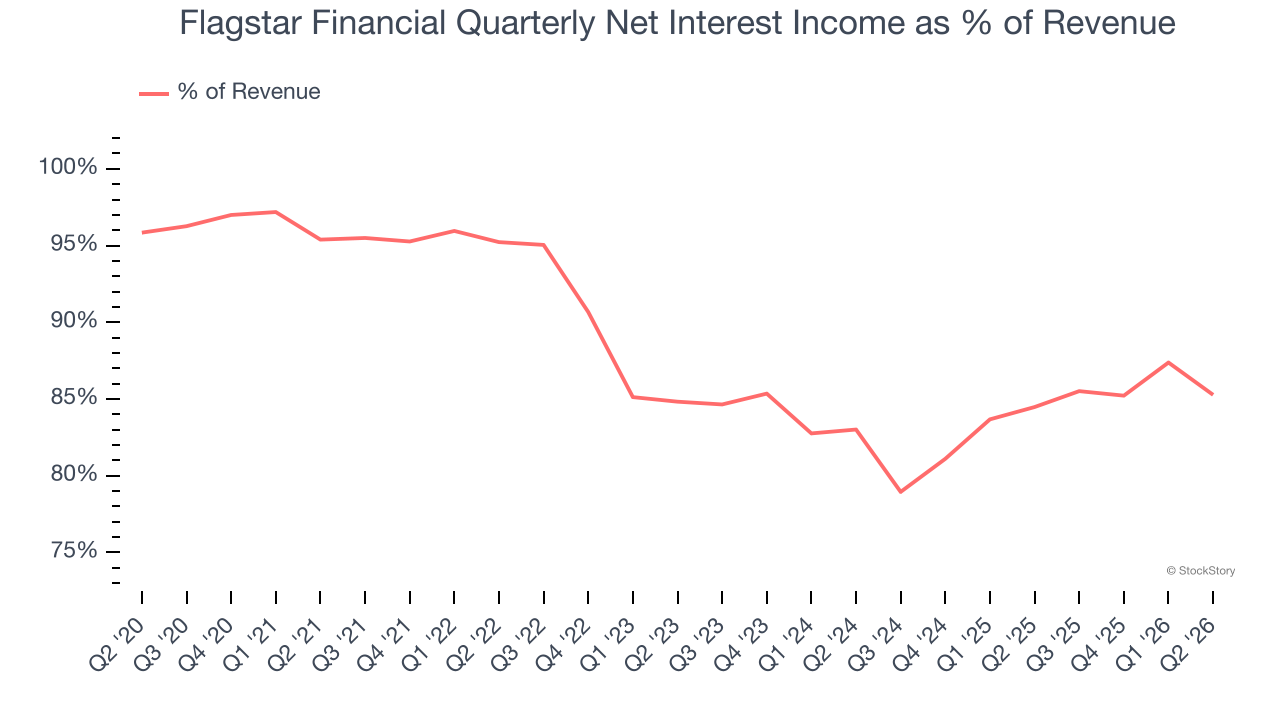
Markets consistently prioritize net interest income growth over fee-based revenue, recognizing its superior quality and recurring nature compared to the more unpredictable non-interest income streams.
WHILE YOU’RE HERE: The Next Palantir? One satellite company captures images of every point on Earth. Every single day. The Pentagon wants it. Hedge funds are using it to beat earnings. You’ve probably never heard of it.
This is what the early days of Palantir looked like before it became a giant. Same playbook. Different technology. If you missed Palantir, you need to see this. Claim The Stock Ticker for Free HERE.
Tangible Book Value Per Share (TBVPS)
Banks profit by intermediating between depositors and borrowers, making them fundamentally balance sheet-driven enterprises. Market participants emphasize balance sheet quality and sustained book value growth when evaluating these institutions.
This is why we consider tangible book value per share (TBVPS) the most important metric to track for banks. TBVPS represents the real, liquid net worth per share of a bank, excluding intangible assets that have debatable value upon liquidation. Traditional metrics like EPS are helpful but face distortion from M&A activity and loan loss accounting rules.
Flagstar Financial’s TBVPS declined at a 7.4% annual clip over the last five years. A turnaround doesn’t seem to be in sight as its TBVPS also dropped by 8.4% annually over the last two years ($20.89 to $17.51 per share).
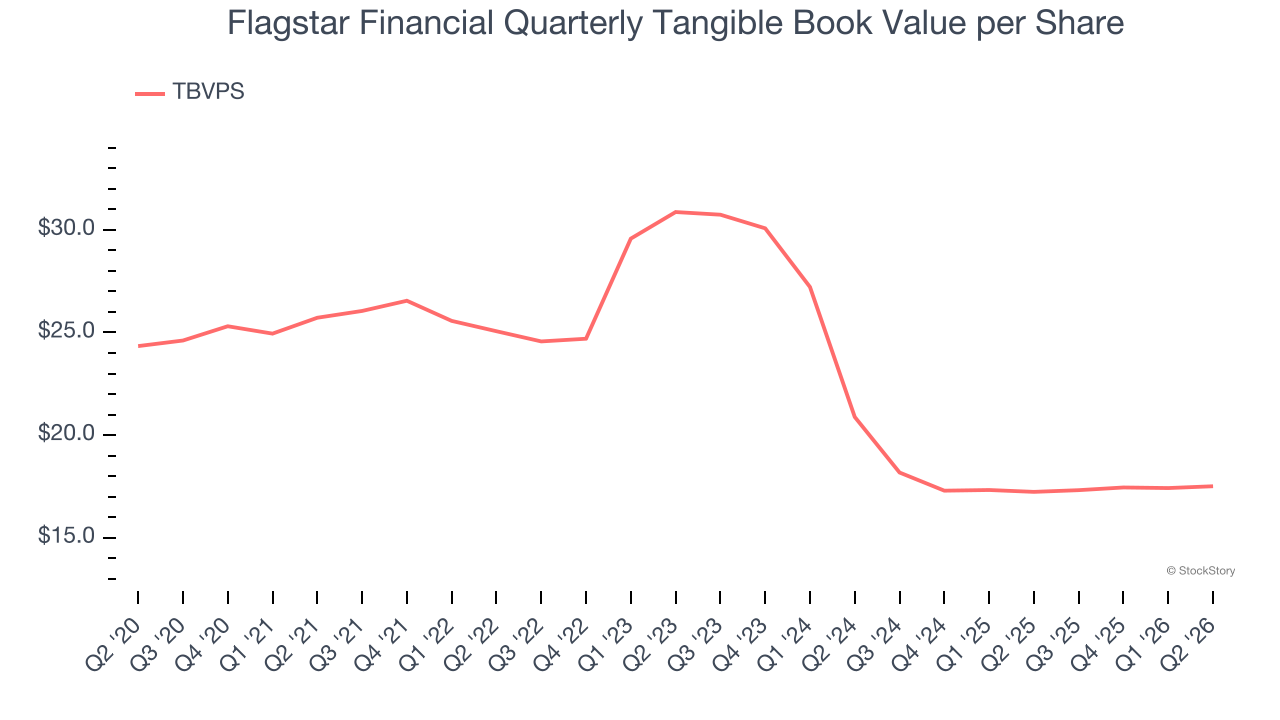
Over the next 12 months, Consensus estimates call for Flagstar Financial’s TBVPS to grow by 7.1% to $18.75, lousy growth rate.
Key Takeaways from Flagstar Financial’s Q2 Results
It was good to see Flagstar Financial narrowly top analysts’ tangible book value per share expectations this quarter. On the other hand, its revenue missed and its net interest income fell short of Wall Street’s estimates. Overall, this quarter could have been better. The stock traded up 3.5% to $15.22 immediately following the results.
So do we think Flagstar Financial is an attractive buy at the current price? What happened in the latest quarter matters, but not as much as longer-term business quality and valuation, when deciding whether to invest in this stock. We cover that in our actionable full research report which you can read here (it’s free).