
Cable, internet, and telephone services provider Charter (NASDAQ: CHTR) met Wall Street’s revenue expectations in Q2 CY2026, but sales fell by 1.7% year on year to $13.53 billion. Its GAAP profit of $10.66 per share was 5.9% above analysts’ consensus estimates.
Is now the time to buy Charter? Find out by accessing our full research report, it’s free.
Charter (CHTR) Q2 CY2026 Highlights:
- Revenue: $13.53 billion vs analyst estimates of $13.51 billion (1.7% year-on-year decline, in line)
- EPS (GAAP): $10.66 vs analyst estimates of $10.06 (5.9% beat)
- Adjusted EBITDA: $5.45 billion vs analyst estimates of $5.57 billion (40.3% margin, 2.2% miss)
- Operating Margin: 22.6%, down from 23.8% in the same quarter last year
- Free Cash Flow Margin: 7.2%, up from 5.3% in the same quarter last year
- Internet Subscribers: down 515,000 year on year
- Market Capitalization: $15.56 billion
"We operate in a competitive environment across all of our products, and our strategy for growing connectivity services is simple -- deliver the best products, at the best overall value, with the best service," said Chris Winfrey, President and CEO of Charter.
Company Overview
Operating as Spectrum, Charter (NASDAQ: CHTR) is a leading telecommunications company offering cable television, high-speed internet, and voice services across the United States.
Revenue Growth
Examining a company’s long-term performance can provide clues about its quality. Any business can put up a good quarter or two, but many enduring ones grow for years. Over the last five years, Charter grew its sales at a weak 1.7% compounded annual growth rate. This was below our standards and is a tough starting point for our analysis.
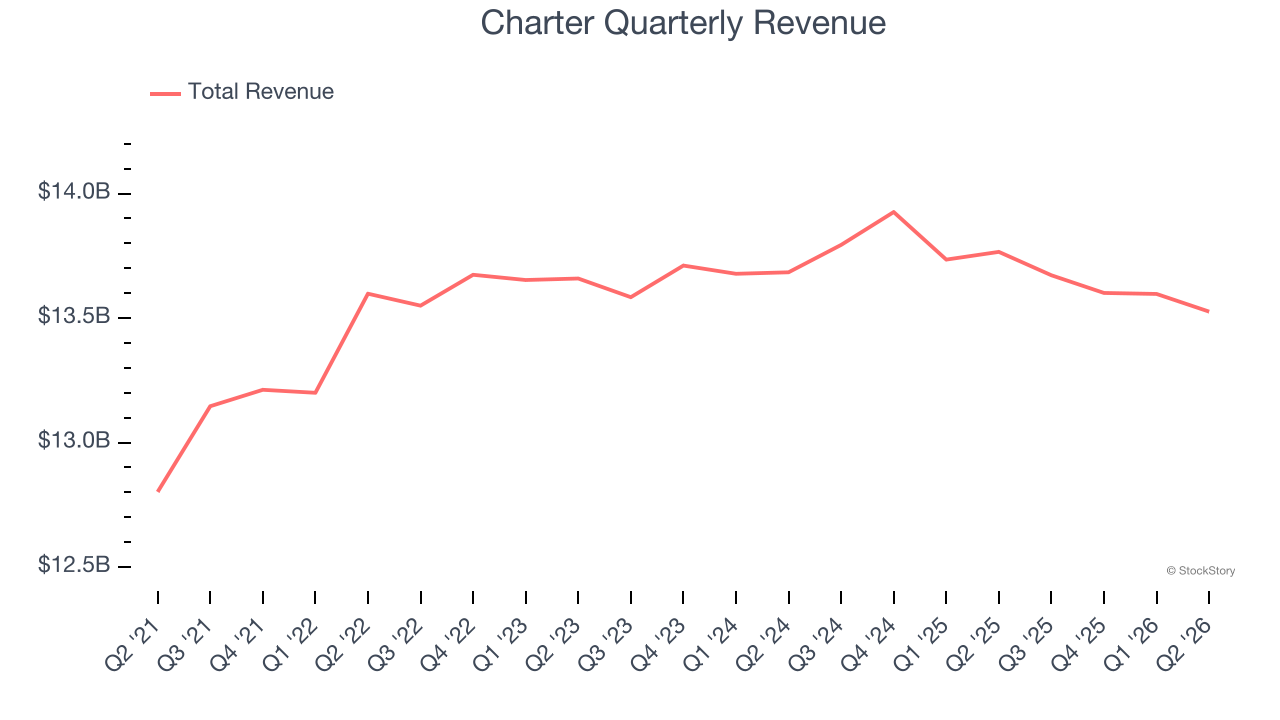
Long-term growth is the most important, but within consumer discretionary, product cycles are short and revenue can be hit-driven due to rapidly changing trends and consumer preferences. Charter’s recent performance shows its demand has slowed as its revenue was flat over the last two years. 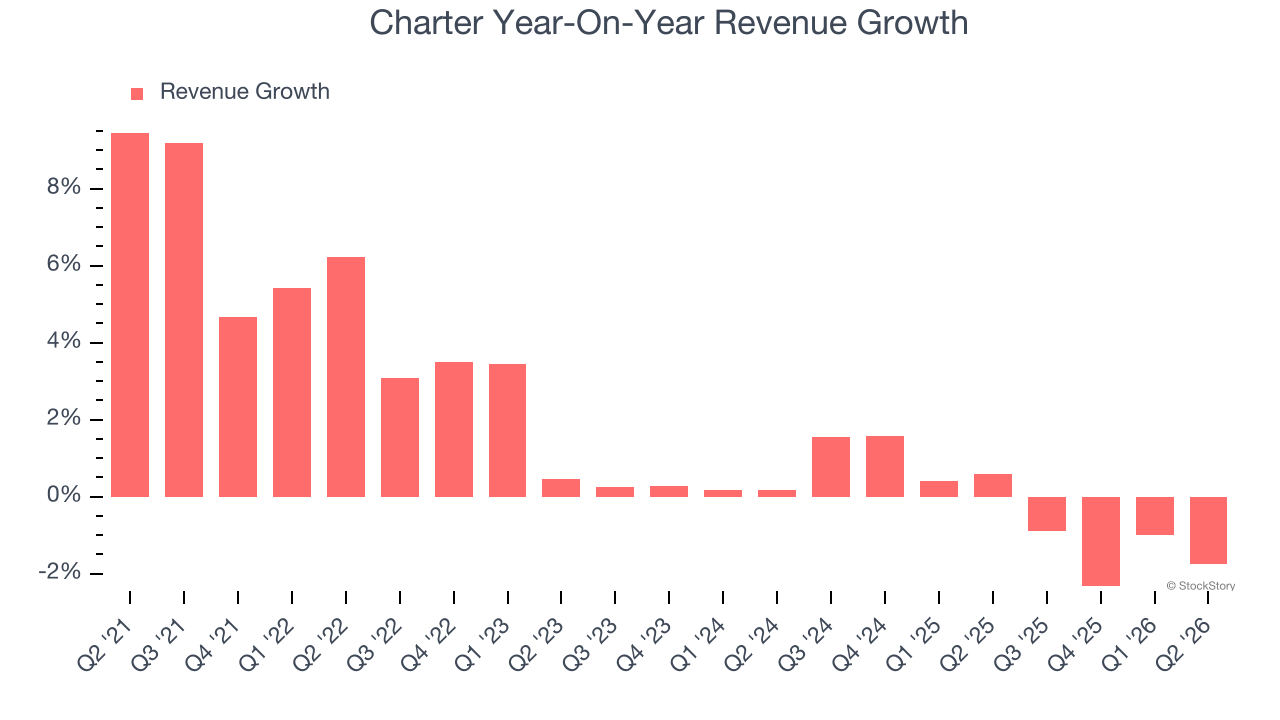
We can dig further into the company’s revenue dynamics by analyzing its number of internet subscribers and video subscribers, which clocked in at 29.39 million and 12.52 million in the latest quarter. Over the last two years, Charter’s internet subscribers averaged 2.5% year-on-year growth. On the other hand, its video subscribers averaged 1.6% year-on-year declines. 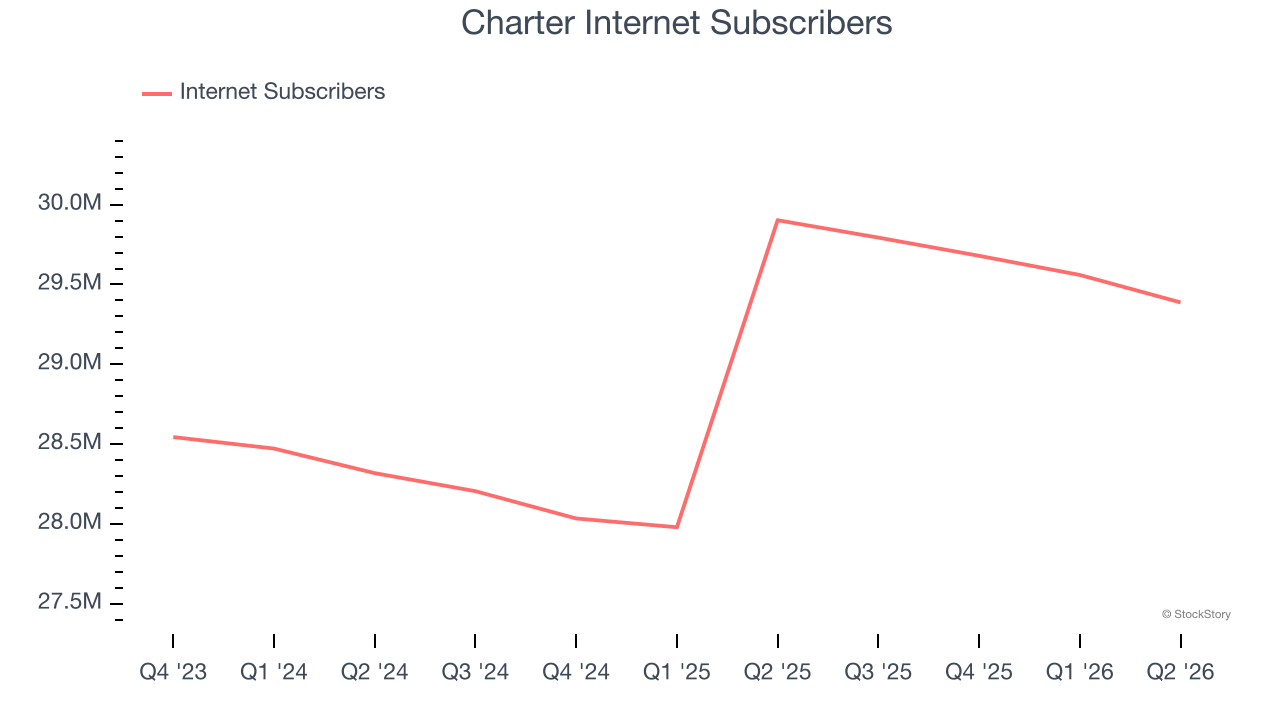
This quarter, Charter reported a rather uninspiring 1.7% year-on-year revenue decline to $13.53 billion of revenue, in line with Wall Street’s estimates.
Looking ahead, sell-side analysts expect revenue to remain flat over the next 12 months. This projection doesn’t excite us and suggests its newer products and services will not catalyze better top-line performance yet.
ONE MORE THING: 3 Hidden Platforms Growing 3X Faster than Amazon, Google, and PayPal. Amazon, Google, and Meta all followed the same playbook: Dominate an ignored market. Build an unbeatable moat. Scale until you’re unstoppable.
These three platforms are running that exact playbook right now. The early investors in Amazon made fortunes. The early investors in these could do the same. Get All 3 Stocks Here for FREE.
Operating Margin
Charter’s operating margin has generally stayed the same over the last 12 months, and we generally like to see margin increases due to economies of scale and cost efficiency over time.
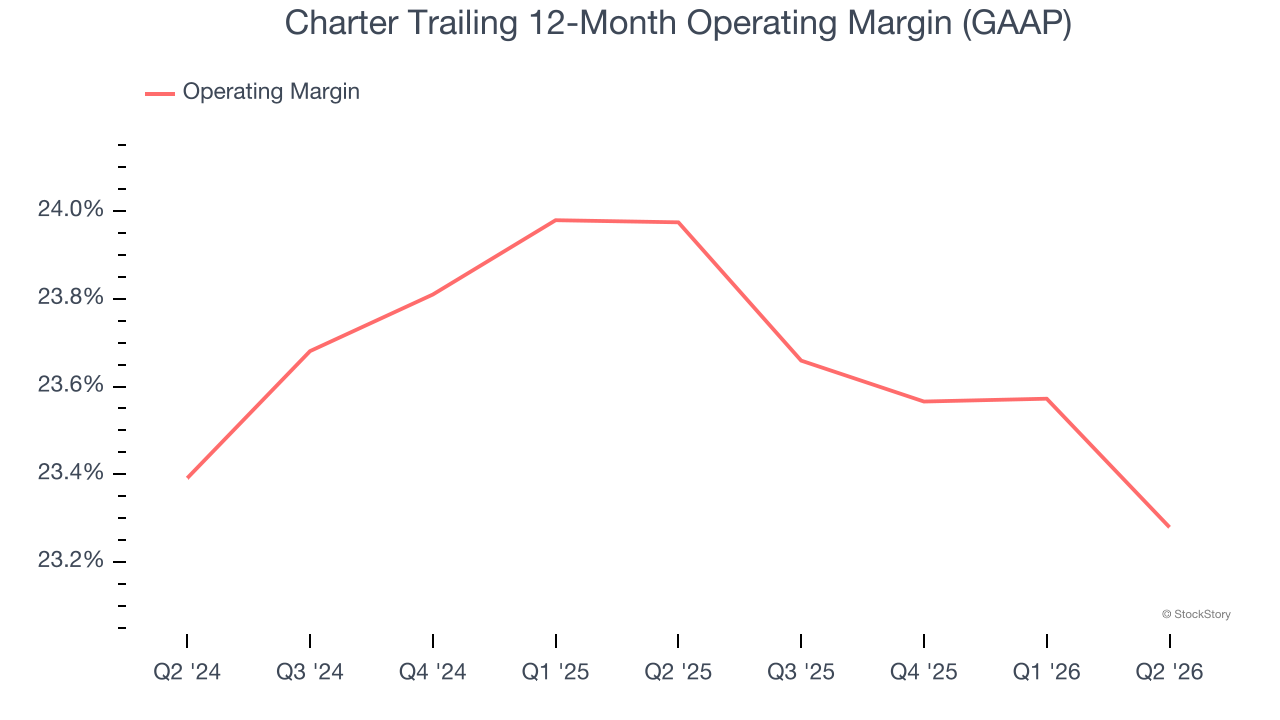
This quarter, Charter generated an operating margin profit margin of 22.6%, down 1.2 percentage points year on year. This reduction is quite minuscule and indicates the company’s overall cost structure has been relatively stable.
Earnings Per Share
We track the long-term change in earnings per share (EPS) for the same reason as long-term revenue growth. Compared to revenue, however, EPS highlights whether a company’s growth is profitable.
Charter’s EPS grew at 15.4% compounded annual growth rate over the last five years. On the bright side, this performance was better than its 1.7% annualized revenue growth and tells us the company became more profitable on a per-share basis as it expanded.
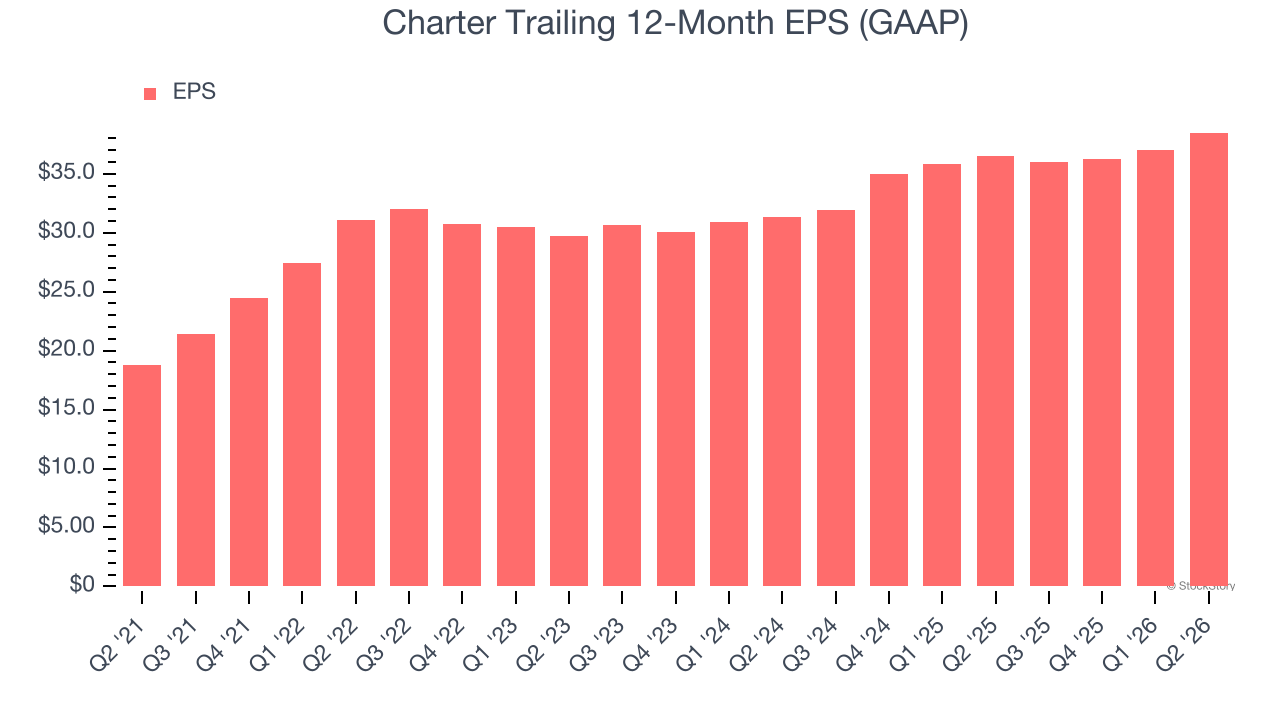
In Q2, Charter reported EPS of $10.66, up from $9.18 in the same quarter last year. This print beat analysts’ estimates by 5.9%. Over the next 12 months, Wall Street expects Charter’s full-year EPS to grow 7.1% from $38.50 to $41.24.
Key Takeaways from Charter’s Q2 Results
It was good to see Charter beat analysts’ EPS expectations this quarter. Zooming out, we think this was a decent quarter. Investors were likely hoping for more, and shares traded down 4.5% to $120.75 immediately after reporting.
Should you buy the stock or not? The latest quarter does matter, but not nearly as much as longer-term fundamentals and valuation, when deciding if the stock is a buy. We cover that in our actionable full research report which you can read here (it’s free).