
Archer-Daniels-Midland’s 28% return over the past six months has outpaced the S&P 500 by 20.1%, and its stock price has climbed to $86.22 per share. This run-up might have investors contemplating their next move.
Is now the time to buy Archer-Daniels-Midland, or should you be careful about including it in your portfolio? Get the full breakdown from our expert analysts, it’s free.
Why Is Archer-Daniels-Midland Not Exciting?
We’re happy investors have made money, but we’re passing on Archer-Daniels-Midland for now. Here are three reasons why there are better opportunities than ADM, plus one stock we’d rather own.
1. Revenue Spiraling Downwards
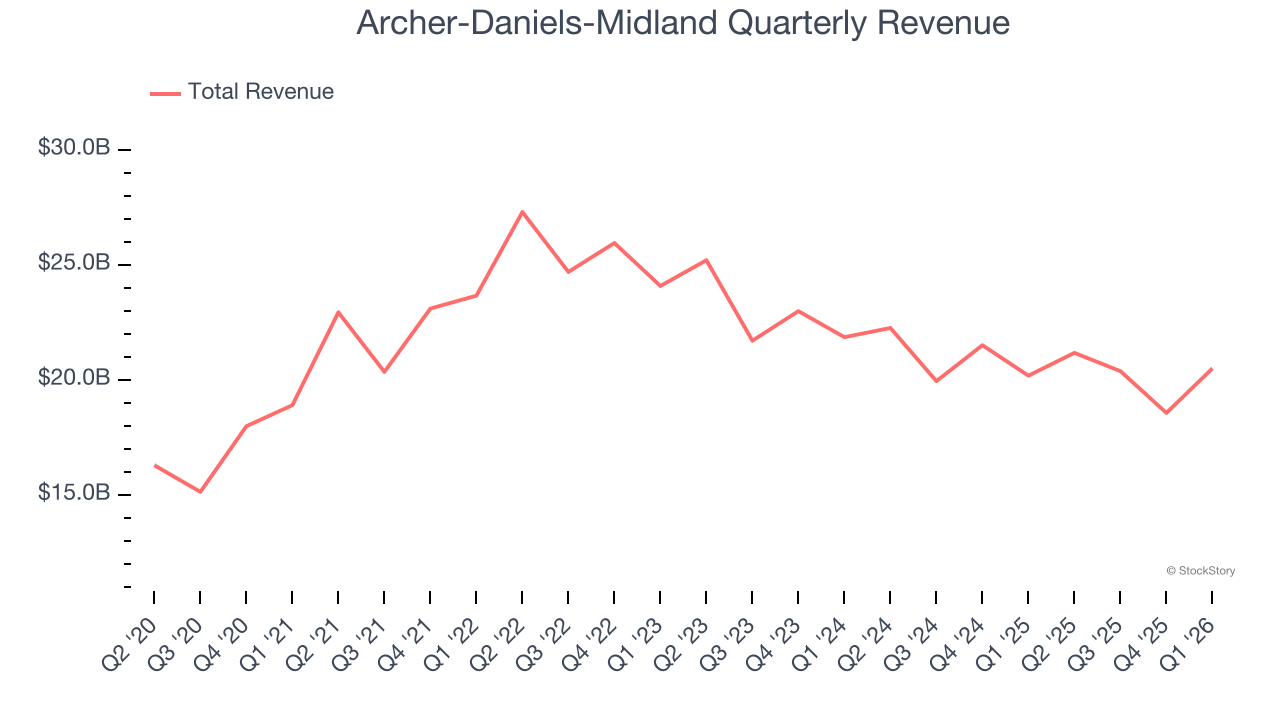
Examining a company’s long-term performance can provide clues about its quality. Any business can have short-term success, but a top-tier one grows for years. Archer-Daniels-Midland struggled to consistently generate demand over the last three years as its sales dropped at a 7.5% annual rate. This was below our standards and signals it’s a lower quality business.
2. Low Gross Margin Reveals Weak Structural Profitability
All else equal, we prefer higher gross margins because they make it easier to generate more operating profits and indicate that a company commands pricing power by offering more differentiated products.
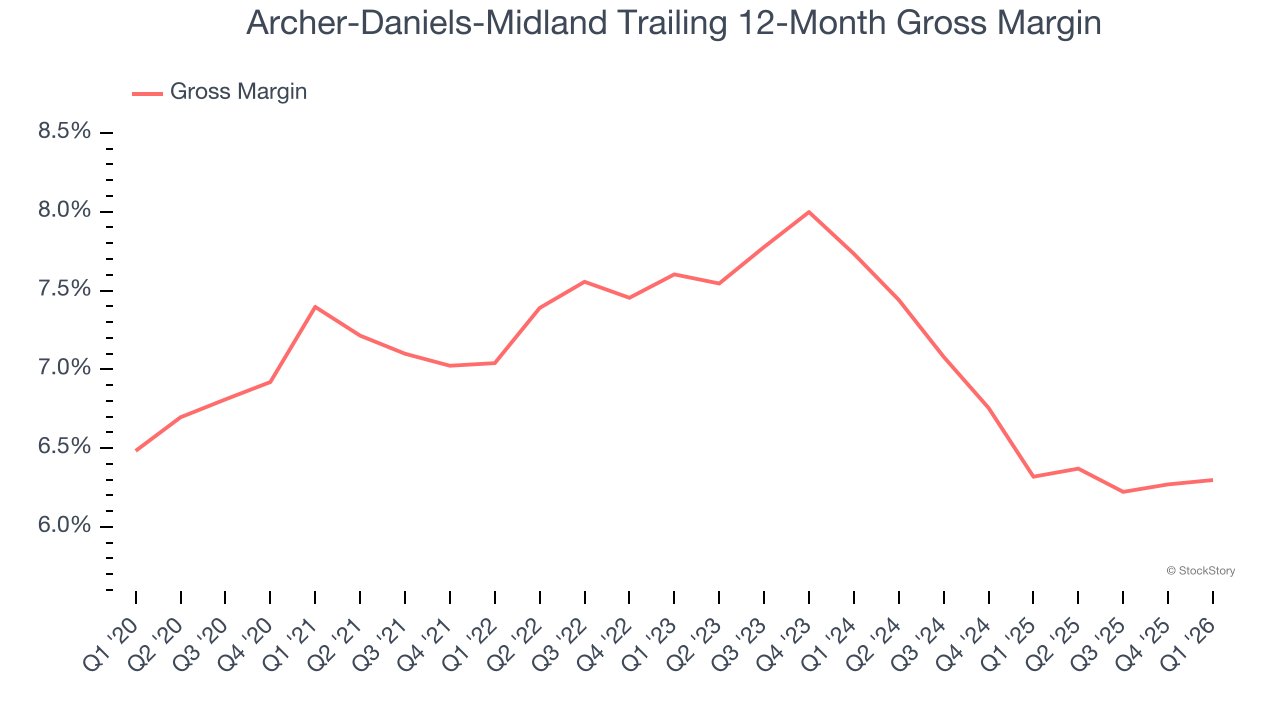
Archer-Daniels-Midland has bad unit economics for a consumer staples company, signaling it operates in a competitive market and lacks pricing power because its products can be substituted. As you can see below, it averaged a 6.3% gross margin over the last two years. That means Archer-Daniels-Midland paid its suppliers a lot of money ($93.69 for every $100 in revenue) to run its business.
3. EPS Trending Down
Analyzing the long-term change in earnings per share (EPS) shows whether a company’s incremental sales were profitable — for example, revenue could be inflated through excessive spending on advertising and promotions.
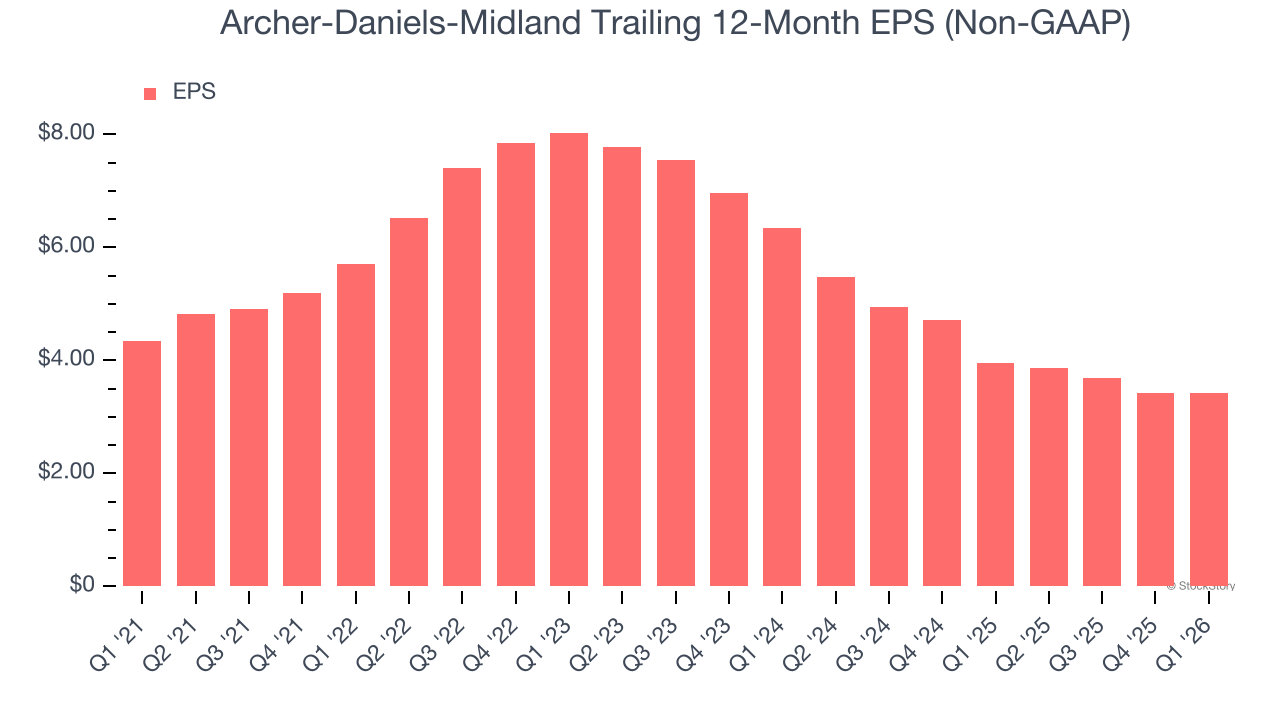
Sadly for Archer-Daniels-Midland, its EPS declined by 24.7% annually over the last three years, more than its revenue. This tells us the company struggled because its fixed cost base made it difficult to adjust to shrinking demand.
Final Judgment
Archer-Daniels-Midland’s business quality ultimately falls short of our standards. With its shares beating the market recently, the stock trades at 16× forward P/E (or $86.22 per share). While this valuation is fair, the upside isn’t great compared to the potential downside. We’re fairly confident there are better investments elsewhere. We’d recommend looking at the most entrenched endpoint security platform on the market.
Stocks We Like More Than Archer-Daniels-Midland
ONE MORE THING: Top 5 Growth Stocks. The biggest stock winners almost always had one thing in common before they ran. Revenue growing like crazy. Meta. CrowdStrike. Broadcom. Our AI flagged all three. They returned 315%, 314%, and 455%, respectively.
Find out which 5 stocks it’s flagging this month — FREE. Get Our Top 5 Growth Stocks for Free HERE.
Stocks that have made our list include now familiar names such as Nvidia (+1,460% between June 2020 and June 2025) as well as under-the-radar businesses like the once-micro-cap company Kadant (+214% between June 2020 and June 2025). Find your next big winner with StockStory today.