- Q1 2026 revenue of $36.0 million with IM8 revenue of $33.8 million, up 23.1% from IM8 revenue of $27.4 million in Q4 2025 and nearly 6x year-over-year from IM8 revenue of $5.7 million in Q1 2025
- Raises full-year 2026 IM8 revenue guidance to $190 million to $210 million (previously $180 million to $200 million)
- Projects Q2 2026 revenue of $46 million to $48 million, with IM8 contributing $44 million to $46 million, representing approximately 33% sequential quarterly growth for IM8
- Fully divested digital asset holdings for $41.3 million (510 units at ~$80,980)
- Three new SKUs planned for Q4 2026 across Hydration, Creatine, and Kids’ Gummies
- Appointed consumer supplements finance veteran Brian J. Rosin as Chief Financial Officer of IM8
- Latest investor deck can be found at https://ir.prenetics.com
NEW YORK, June 10, 2026 (GLOBE NEWSWIRE) -- Prenetics Global Limited (NASDAQ: PRE) ("Prenetics" or the "Company"), a leading consumer health sciences company and parent of the IM8 premium health and longevity brand, today announced its financial results for the first quarter ended March 31, 2026. These results supersede the preliminary unaudited results announced on May 14, 2026 (the "Preliminary Announcement"). Revenue, gross profit, loss from operations, EBITDA1 and Adjusted EBITDA2 for the first quarter ended March 31, 2026, as set forth in this press release, are consistent with the preliminary estimates in the Preliminary Announcement. Loss for the period reflects completion of the Company’s quarter-end closing procedures as described below.
For the convenience of readers, this announcement consolidates the key operational, strategic and balance sheet information previously furnished in the Preliminary Announcement, together with the Company's complete financial statements for the first quarter ended March 31, 2026.
Comparison to Preliminary Announcement
The Q1 2026 results are consistent in all material respects with the preliminary estimates set out in the Preliminary Announcement. Revenue of $36.0 million, gross profit of $23.3 million, loss from operations of $8.9 million, and adjusted EBITDA loss of $5.6 million are each consistent with the preliminary figures.
Loss for the period of $23.1 million reflects completion of the Company’s quarter-end closing procedures, including the final valuation of (i) warrant liabilities associated with the Company's December 2025 warrant exchange program and (ii) share consideration received in connection with the disposal of the Europa 3PL business completed in January 2026. Loss for the period was driven primarily by two non-cash, non-operating items: an unrealized fair-value loss on digital assets of approximately $9.8 million, reflecting the decline in Bitcoin prices during the quarter, and a fair-value loss on warrant liabilities of approximately $8.0 million, driven primarily by the appreciation of the Company’s share price, which increases the carrying value of the warrant liability. Neither item affects revenue, gross profit, loss from operations or adjusted EBITDA, and neither involves any cash outflow.
Q1 2026 Financial Results
| Three Months Ended (Unaudited) | |||||||||||
| March 31, | December 31, | March 31, | |||||||||
| 2026 | 2025 | 2025 | |||||||||
| (in thousands of U.S. dollars) | |||||||||||
| Continuing operations | |||||||||||
| Revenue | $ | 35,954 | $ | 33,288 | $ | 8,275 | |||||
| Gross profit | 23,283 | 21,377 | 5,607 | ||||||||
| Loss from operations | (8,866 | ) | (11,514 | ) | (5,971 | ) | |||||
| EBITDA | (23,177 | ) | (7,430 | ) | (11,074 | ) | |||||
| Adjusted EBITDA | (5,599 | ) | (1,836 | ) | (2,439 | ) | |||||
The below tables set out our revenue and gross profit by business unit for the quarters ended March 31, 2026, December 31, 2025, and March 31, 2025.
| Three Months Ended (Unaudited) | ||||||||
| March 31, 2026 | ||||||||
| Revenue | Gross profit | Gross margin | ||||||
| (in thousands of U.S. dollars) | ||||||||
| Continuing operations | ||||||||
| CircleDNA | $ | 2,172 | $ | 1,555 | 72 | % | ||
| IM8 | 33,782 | 21,728 | 64 | % | ||||
| $ | 35,954 | $ | 23,283 | 65 | % | |||
| Three Months Ended (Unaudited) | ||||||||
| December 31, 2025 | ||||||||
| Revenue | Gross profit | Gross margin | ||||||
| (in thousands of U.S. dollars) | ||||||||
| Continuing operations | ||||||||
| CircleDNA | $ | 5,840 | $ | 4,864 | 83 | % | ||
| IM8 | 27,448 | 16,513 | 60 | % | ||||
| $ | 33,288 | $ | 21,377 | 64 | % | |||
| Three Months Ended (Unaudited) | ||||||||
| March 31, 2025 | ||||||||
| Revenue | Gross profit | Gross margin | ||||||
| (in thousands of U.S. dollars) | ||||||||
| Continuing operations | ||||||||
| CircleDNA | $ | 2,543 | $ | 2,192 | 86 | % | ||
| IM8 | 5,732 | 3,415 | 60 | % | ||||
| $ | 8,275 | $ | 5,607 | 68 | % | |||
IM8: A Breakout Global Brand
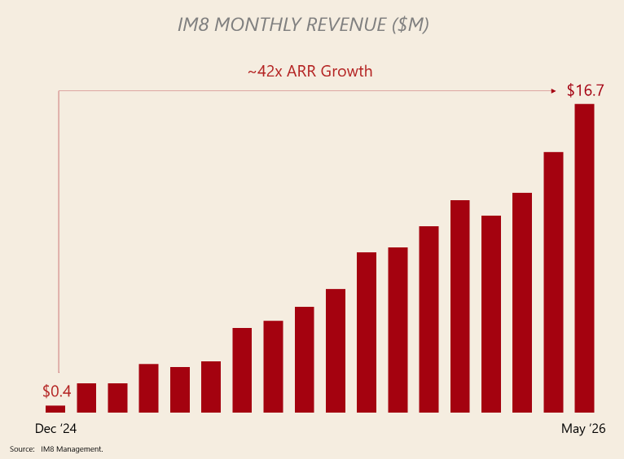
IM8 continued to demonstrate strong global product-market fit and brand momentum, with Q1 2026 revenue of approximately $33.8 million. Momentum has accelerated into the second quarter: IM8 monthly revenue for April 2026 reached approximately $14.0 million, representing approximately 18.6% month-over-month growth, and reached a record of approximately $16.7 million in May 2026, representing approximately 19.3% further month-over-month growth and implying annualized recurring revenue3 of approximately $200 million. IM8 monthly revenue in May 2026 represents approximately 42 times growth in monthly revenue since IM8's launch in December 2024, with the brand now reaching consumers across 43 countries.
IM8 – Key Performance Indicators
| Metric | Q1 2026 | Q4 2025 | Growth | ||||||
| Monthly Revenue (End of Period) | $11.8 million | $10.0 million | +18% | ||||||
| Quarterly Revenue | $33.8 million | $27.4 million | +23% | ||||||
| Total Customer Orders | 220,000+ | 230,000+ | (4)% | ||||||
| Total Servings Delivered | 8.8 million+ | 6.9 million+ | +28% | ||||||
| New Customer Average Order Value | $240 | $157 | +53% | ||||||
| Average Order Value (Last Month of Period) | $159 | $133 | +20% | ||||||
| New Customer Subscription Rate | ~79% | ~80% | Maintained | ||||||
| Gross Margin | ~64% | ~60% | +4% | ||||||
IM8 delivered meaningful gross margin expansion in Q1 2026, improving from approximately 60% in Q4 2025 to approximately 64% in Q1 2026, an approximately 400 basis point increase quarter-over-quarter. The improvement was driven by a combination of scale-driven manufacturing efficiencies as production volumes increased across the Daily Ultimate Essentials Pro and Daily Ultimate Longevity lines, renegotiated unit economics with key contract manufacturers and ingredient suppliers, a favorable product mix shift toward higher-margin SKUs and subscription orders, packaging optimization, and improved fulfillment and freight efficiencies as order density grew across our 43 international markets. The Company expects to maintain gross margin efficiencies through the balance of 2026 as volumes scale further and supply chain initiatives mature.
Total servings delivered grew approximately 28% quarter-over-quarter to over 8.8 million, reflecting accelerating consumer engagement and increased product consumption across IM8’s global customer base. Total customer orders declined modestly quarter-over-quarter to approximately 220,000, due to IM8’s deliberate and strategic transition toward quarterly subscription plans, which consolidate three months of customer demand into a single, larger order. As a result, average servings per order increased approximately 33% in Q1 2026, consistent with broader quarterly plan adoption. On a cumulative basis, IM8 has now delivered more than 43 million servings to customers worldwide since launch, and in May 2026 averaged more than 160,000 servings delivered per day, reflecting the strength and consistency of underlying consumption.
Global Diversification of IM8 Revenue
IM8 continues to expand its international reach, and by the end of Q1 2026, IM8 shipped to 43 countries, with over 60% of IM8 revenue generated outside the United States. This international momentum provides a strong foundation for continued global expansion in 2026.
Top Five IM8 Markets (Q1 2026)
| Market | Q1 2026 IM8 Revenue | % of Total Q1 2026 IM8 Revenue | |||
| United States | $12.8M | 38.7 | % | ||
| Canada | $4.5M | 13.7 | % | ||
| United Kingdom | $3.2M | 9.8 | % | ||
| Australia | $1.9M | 5.6 | % | ||
| Singapore | $1.4M | 4.2 | % | ||
Strategic Evolution Toward Quarterly Subscriptions
Following the initial rollout of quarterly subscription plans in the United States in Q4 2025, IM8 expanded quarterly subscription availability across international markets in Q1 2026. This international rollout validated the Company’s strategy to enhance cash flow, increase upfront customer commitment, improve logistics efficiency, and enhance customer lifetime value across a broader global customer base.
The impact of this transition has been substantial:
- FY2025 average order value: approximately $110
- Q4 2025 (last month of period) average order value: approximately $133
- Q1 2026 (new customer) average order value: approximately $240
IM8’s new customer average order value increased to approximately $240 in Q1 2026, reflecting the broader adoption of quarterly subscription plans following the international rollout, together with continued demand for higher-value product bundles, including the Beckham Stack. Quarterly plans represented a meaningful portion of new customer mix in Q1 2026, with approximately half of Beckham Stack customers and more than one-third of Daily Ultimate Essentials Pro customers choosing quarterly subscriptions.
Management Commentary
Danny Yeung, Chief Executive Officer and Co-Founder, commented: “The momentum behind IM8 is extraordinary. Q1 2026 was a defining quarter — IM8 revenue grew nearly 6x year-over-year and 23.1% sequentially over Q4 2025, and our quarterly subscription strategy delivered a step-change in customer economics. The acceleration has continued into Q2 2026: IM8 monthly revenue reached approximately $14.0 million in April, and reached a record of approximately $16.7 million in May, implying annualized recurring revenue of approximately $200 million.
Based on this trajectory, we currently expect Q2 2026 revenues of approximately $46 million to $48 million, with IM8 contributing approximately $44 million to $46 million, and we are raising our full-year 2026 IM8 revenue guidance to $190 million to $210 million, from our prior range of $180 million to $200 million. The strength of our underlying unit economics, the global pull we are seeing from consumers across more than 40 markets, and the upside in new marketing channels give us strong conviction.
Looking ahead, I am especially excited about our product roadmap. In Q4 2026, IM8 plans to launch new offerings in three meaningful categories with very large addressable markets — hydration, creatine, and kids’ gummies — extending the brand into high-growth segments. What we have built with David Beckham, our elite roster of athlete partners, and our world-class scientific advisory board is becoming a category-defining global health brand. Q1 proved the model. Q2 is proving the acceleration. The rest of 2026 will demonstrate the scale of the opportunity ahead.”
A World-Class Roster of Athlete Partners and Equity-Aligned Ambassadors
A defining feature of the IM8 brand is its roster of world-class athlete partners, each of whom has a direct equity-based alignment with the Company’s long-term success. Co-founded with David Beckham, IM8 is championed by World No. 1 tennis player Aryna Sabalenka, Formula 1 driver Ollie Bearman of Haas F1 Team, and two-time NBA Most Valuable Player Giannis Antetokounmpo, each of whom holds equity in Prenetics. Most recently, IM8 announced a multi-year strategic partnership with Inter Miami CF, which includes an equity stake for Inter Miami CF in Prenetics, together with name, image and likeness rights for a minimum of four Inter Miami CF players, including Lionel Messi, and the establishment of an IM8 Nutrition Center at the club’s training facility. The Company believes this equity-based partnership model creates deeper, longer-term alignment than traditional endorsement arrangements, while supporting global brand reach across some of the most engaged sports audiences in the world.
Expanding the IM8 Product Portfolio – New Q4 2026 Launches
IM8 plans to extend its product portfolio in Q4 2026 with new offerings in three adjacent categories: hydration, creatine, and kids’ gummies. These categories represent large, fast-growing segments of the global consumer health market — the global hydration category is approximately $37 billion, growing 8% annually; the global creatine category is approximately $1.3 billion, growing 26% annually; and the global kids' supplements category is approximately $3.6 billion, growing 8% annually, according to Grand View Research — and each is a natural extension of IM8’s daily nutrition platform. Each launch will adhere to the same standards that define IM8’s flagship Daily Ultimate Essentials Pro product, including premium ingredient quality, science-backed formulation and rigorous third-party testing. The Company believes these launches will broaden IM8’s addressable market, increase customer lifetime value through additional household use cases, and support continued revenue diversification beyond IM8’s flagship SKU.
A Strong, Debt-Free Balance Sheet
Prenetics maintained a strong, debt-free balance sheet as of March 31, 2026, with cash and cash equivalents of $56.0 million and no debt. The Company had net current assets of $106.5 million as of March 31, 2026, up from $56.5 million as of December 31, 2025. Prenetics held digital assets of $34.8 million as of March 31, 2026. Subsequent to March 31, 2026, the Company divested its digital asset holdings in full, selling 510 units for total cash proceeds of approximately $41.3 million, at an average price of approximately $80,980 per unit, which have been received by the Company.
As of May 31, 2026, the Company had estimated cash balances across its accounts of approximately $83.4 million. In addition, the Company held current financial assets measured at fair value through profit or loss, representing investments in investment funds, of approximately $50.2 million based on the latest available valuations, and cash consideration held in escrow and holdback, recorded under other receivables, of approximately $6.1 million. As of May 31, 2026, the combined total of the Company’s estimated cash balances, current financial assets measured at fair value through profit or loss, and cash consideration held in escrow and holdback, was approximately $139.7 million.
Returning Capital to Shareholders
On March 6, 2026, the Company announced a $40 million share repurchase program. From program launch on March 6, 2026 through May 13, 2026, the Company has repurchased 968,349 of its Class A Ordinary Shares in open-market transactions for a total purchase price of approximately $19 million. The repurchase program reflects the Board’s confidence in the long-term value of the Company and complements continued investment in IM8’s growth initiatives. The Company intends to continue executing repurchases under the authorized program in a disciplined manner, subject to market conditions and applicable regulatory requirements.
Advancing Global Nutrition – Partnership with Vitamin Angels
In April 2026, Prenetics announced a global partnership between IM8 and Vitamin Angels, a leading global public health nonprofit with a 31-year track record, a four-star Charity Navigator rating, and the infrastructure to reach more than 74 million women and children annually across 65+ countries. Under the partnership, IM8 has committed to impacting 400,000 pregnant women, infants, and children under five in underserved communities during the first year, with a long-term goal to impact millions of lives through sustained funding and awareness. The partnership extends IM8’s mission beyond premium nutrition to address malnutrition among the world’s most vulnerable populations.
Strengthening IM8 Leadership for the Next Phase of Growth
IM8 also strengthened its leadership team with the appointment of Brian J. Rosin as Chief Financial Officer of IM8. Mr. Rosin is based in the United States and brings significant experience across consumer health, e-commerce operations, finance, and strategic execution, having previously served as CFO of Wellbeam Consumer Health and NATURELO Premium Supplements. His appointment adds dedicated financial and operational leadership to support IM8’s next phase of global growth, disciplined execution, and strategic initiatives.
Outlook
IM8 generated revenue of approximately $30.7 million for the two months ended May 31, 2026. The Company expects Q2 2026 revenue in the range of approximately $46 million to $48 million, with IM8 contributing approximately $44 million to $46 million, representing approximately 33% sequential quarterly growth for IM8. The Company is raising its full-year 2026 IM8 revenue guidance to $190 million to $210 million (previously $180 million to $200 million). These guidance ranges are consistent with those set out in the Preliminary Announcement and reflect management’s current estimates as of the date of this announcement.
About Prenetics
Prenetics (NASDAQ: PRE) is a leading health sciences company dedicated to advancing human health and longevity. The Company’s flagship consumer brand, IM8, co-founded with David Beckham and championed by World No. 1 tennis player Aryna Sabalenka, is redefining the premium daily nutrition category through science-backed formulations and global brand partnerships. Since its launch, IM8 has become one of the fastest-growing brands in consumer health, achieving an impressive milestone of surpassing $100 million in annualized recurring revenue within just 11 months of operations, and is now sold in more than 40 countries worldwide.
About IM8
IM8 is the pinnacle of premium core nutrition, born from a collaboration between David Beckham as a co-founding partner, and an elite team of scientists spanning medical professionals, academia and space science. Combining cutting-edge science with nature’s most potent ingredients, IM8 delivers a holistic, science-backed approach to health, empowering you to live your most vibrant life. IM8’s flagship product, Daily Ultimate Essentials Pro, is an all-in-one powder supplement engineered to replace 16 different supplements in a delicious drink and is NSF Certified for Sport, non-GMO, vegan, free from common allergens, and contains no artificial flavors, colors or sweeteners. IM8 is a subsidiary of Prenetics (NASDAQ: PRE), a leading global health sciences company dedicated to advancing consumer health. To learn more about IM8, please visit www.IM8health.com.
Investor Relations Contact
investors@prenetics.com
PRE@mzgroup.us
Angela Cheung
Investor Relations / Corporate Finance
angela.hm.cheung@prenetics.com
Forward-Looking Statements
This press release contains forward-looking statements. These statements are made under the “safe harbor” provisions of the U.S. Private Securities Litigation Reform Act of 1995. Statements that are not historical facts, including statements about the Company’s goals, targets, projections, outlooks, beliefs, expectations, strategy, plans, objectives of management for future operations of the Company, and growth opportunities are forward-looking statements. Our guidance reflects management’s current estimates and assumptions as of the date of this release, is subject to significant risks and uncertainties, and is not a guarantee of future performance. Actual results may differ materially. In some cases, forward-looking statements can be identified by words or phrases such as “may,” “will,” “expect,” “anticipate,” “target,” “aim,” “estimate,” “intend,” “plan,” “believe,” “potential,” “continue,” “is/are likely to,” “guidance,” “outlook,” “forecast,” or other similar expressions. Forward-looking statements are based upon estimates and forecasts and reflect the views, assumptions, expectations, and opinions of the Company, which involve inherent risks and uncertainties, and therefore they should not be relied upon as being necessarily indicative of future results. A number of factors could cause actual results to differ materially from those contained in any forward-looking statement, including but not limited to: the Company may not be able to maintain and enhance its IM8 business and brand if it suffers negative publicity or fails to maintain a strong base of engaged customers and content creators, or otherwise fails to meet customers’ expectations; the Company’s ability to further develop and grow its business, including new products and services; and its ability to identify and execute on M&A opportunities. In addition to the foregoing factors, you should also carefully consider the other risks and uncertainties described in the “Risk Factors” section of the Company’s most recent registration statement and the prospectus therein, and the other documents filed by the Company from time to time with the U.S. Securities and Exchange Commission. Unless otherwise specified, all information provided in this press release is as of the date of this press release, and the Company does not undertake any duty to update such information, except as required under applicable law. Nothing in this press release constitutes an offer to sell, or the solicitation of an offer to buy, any securities of the Company.
Basis of Presentation
Figures for prior periods have been re-presented in accordance with IFRS 5 Non-current Assets Held for Sale and Discontinued Operations (“IFRS 5”). As part of the Group’s strategic repositioning to focus its resources and capital allocation on its core consumer health and prevention businesses, the Group has divested or exited certain non-core businesses and investments, including ACT Genomics, Europa and Insighta.
In June 2025, the Group determined that ACT Genomics Holdings Company Limited (“ACT Genomics”) met the criteria to be classified as held for sale and a discontinued operation, following the signing of a definitive sale and purchase agreement with Delta Electronics, Inc. The divestment of ACT Genomics was completed on October 1, 2025, and its results have been excluded from the Group’s continuing operations thereafter.
The Group also completed the divestiture of substantially all of the assets of its Europa business in January 2026. Accordingly, Europa’s results are included in the Group’s financial results only up to the date of completion of the divestiture and are excluded from the Group’s continuing operations thereafter.
In February 2026, the Group completed the disposal of its remaining equity interest in Insighta Holdings Limited (“Insighta”). Accordingly, the Group’s share of results from Insighta is included only up to the date of completion of the disposal.
In accordance with IFRS 5, the results of discontinued operations are presented separately from the Group’s continuing operations (comprising IM8 and CircleDNA) in the unaudited consolidated statements of profit or loss and other comprehensive income, and comparative figures for those statements have been re-presented accordingly.
The financial information presented in this press release was unaudited. Unaudited non-IFRS financial measures have been provided in this press release. An explanation of these measures is also included below under the heading “Unaudited Non-IFRS Financial Measures”.
Unaudited Non-IFRS Financial Measures
To supplement the Company’s consolidated financial statements prepared in accordance with IFRS Accounting Standards, the Company is providing the following non-IFRS measures: EBITDA and adjusted EBITDA. These non-IFRS financial measures are not based on any standardized methodology prescribed by IFRS Accounting Standards and are not necessarily comparable to similarly-titled measures presented by other companies. Management believes these non-IFRS financial measures are useful to investors in evaluating the Company’s ongoing operating results and trends.
EBITDA is defined as net loss before (1) depreciation and amortization, (2) interest income, (3) other finance costs, and (4) income tax expense.
Adjusted EBITDA is defined as EBITDA further adjusted to exclude (1) amortization of deferred expenses, (2) equity-settled share-based payment expenses, (3) non-recurring expenses related to acquisition, disposal and fundraising, (4) strategic realignment expenses, (5) exchange gain or loss, net, (6) fair value loss/(gain) on financial assets at fair value through profit or loss, (7) fair value loss on warrant liabilities, (8) gain on warrant exchange, (9) unrealized fair value loss on digital asset, and (10) (profit)/loss from discontinued operations, net of tax.
In addition, other companies, including companies in the same industry, may not use the same non-IFRS measures or may calculate these metrics in a different manner than management, or may use other financial measures to evaluate their performance, all of which could reduce the usefulness of these non-IFRS measures as comparative measures. Because of these limitations, the Company’s non-IFRS financial measures should not be considered in isolation from, or as a substitute for, financial information prepared in accordance with IFRS Accounting Standards.
Investors are encouraged to review the breakdown provided in the non-IFRS reconciliation set forth in the below table captioned “Reconciliation of loss for the period under IFRS Accounting Standards and adjusted EBITDA (Non-IFRS).”
PRENETICS GLOBAL LIMITED
Unaudited consolidated statements of financial position
(All amounts in thousands of U.S. dollars (“$”))
| March 31, | December 31, | ||||
| 2026 | 2025 | ||||
| (Unaudited) | (Audited) | ||||
| Assets | |||||
| Property, plant and equipment | $ | 594 | $ | 1,763 | |
| Intangible assets | 40 | 66 | |||
| Digital assets | 34,799 | 44,629 | |||
| Goodwill | — | 1,379 | |||
| Interests in equity-accounted investees | — | 66,109 | |||
| Financial assets at fair value through profit or loss - non-current | 2,338 | 252 | |||
| Other non-current assets | 5,423 | 6,678 | |||
| Non-current assets | 43,194 | 120,876 | |||
| Inventories | 14,198 | 7,032 | |||
| Trade receivables | 2,529 | 2,978 | |||
| Deposits, prepayments and other receivables | 9,346 | 11,860 | |||
| Amount due from a related company | — | 4 | |||
| Financial assets at fair value through profit or loss - current | 50,018 | 31,192 | |||
| Cash and cash equivalents | 56,017 | 32,131 | |||
| Current assets | 132,108 | 85,197 | |||
| Total assets | $ | 175,302 | $ | 206,073 | |
| Liabilities | |||||
| Deferred tax liabilities | $ | 8 | $ | 8 | |
| Warrant liabilities | 28,354 | 20,319 | |||
| Lease liabilities - non-current | 50 | 437 | |||
| Other non-current liabilities | 228 | 230 | |||
| Non-current liabilities | 28,640 | 20,994 | |||
| Trade payables | 1,961 | 3,142 | |||
| Accrued expenses and other current liabilities | 20,293 | 21,124 | |||
| Contract liabilities | 2,948 | 3,086 | |||
| Lease liabilities - current | 407 | 1,330 | |||
| Tax payable | 31 | 31 | |||
| Current liabilities | 25,640 | 28,713 | |||
| Total liabilities | 54,280 | 49,707 | |||
| Equity | |||||
| Class A ordinary shares | 23 | 23 | |||
| Class B ordinary shares | 2 | 2 | |||
| Reserves | 121,090 | 156,434 | |||
| Total equity attributable to equity shareholders of the Company | 121,115 | 156,459 | |||
| Non-controlling interests | (93 | (93 | |||
| Total equity | 121,022 | 156,366 | |||
| Total equity and liabilities | $ | 175,302 | $ | 206,073 | |
PRENETICS GLOBAL LIMITED
Unaudited consolidated statements of profit or loss and other comprehensive income
(All amounts in thousands of U.S. dollars (“$”) unless otherwise indicated)
| Three Months Ended | |||||||||||
| March 31, | December 31, | March 31, | |||||||||
| 2026 | 2025 | 2025 | |||||||||
| (Unaudited) | (Unaudited) | (Unaudited) | |||||||||
| Continuing operations | |||||||||||
| Revenue | $ | 35,954 | $ | 33,288 | $ | 8,275 | |||||
| Direct costs | (12,671 | ) | (11,911 | ) | (2,668 | ) | |||||
| Gross profit | 23,283 | 21,377 | 5,607 | ||||||||
| Other income and other net gain | 840 | 212 | 204 | ||||||||
| Selling and marketing expenses4 | (22,205 | ) | (16,090 | ) | (4,126 | ) | |||||
| Research and development expenses4 | (1,443 | ) | (743 | ) | (2,007 | ) | |||||
| Administrative and other operating expenses4 | (9,341 | ) | (16,270 | ) | (5,649 | ) | |||||
| Loss from operations | (8,866 | ) | (11,514 | ) | (5,971 | ) | |||||
| Fair value (loss)/gain on financial assets at fair value through profit or loss | (568 | ) | 879 | — | |||||||
| Gain on warrant exchange | — | 36,657 | — | ||||||||
| Fair value loss on warrant liabilities | (8,035 | ) | (17,339 | ) | (63 | ) | |||||
| Unrealized fair value loss on digital assets | (9,830 | ) | (9,725 | ) | — | ||||||
| Other finance costs | (9 | ) | (12 | ) | (18 | ) | |||||
| Loss before taxation | (27,308 | ) | (1,054 | ) | (6,052 | ) | |||||
| Income tax expense | (28 | ) | (37 | ) | (20 | ) | |||||
| Loss from continuing operations | (27,336 | ) | (1,091 | ) | (6,072 | ) | |||||
| Discontinued operation | |||||||||||
| Profit/(loss) from discontinued operation, net of tax5 | 4,231 | (6,451 | ) | (4,944 | ) | ||||||
| Loss for the period | (23,105 | ) | (7,542 | ) | (11,016 | ) | |||||
| Other comprehensive (expense)/income for the period | |||||||||||
| Items that will not be reclassified subsequently to profit or loss: | |||||||||||
| Share of other comprehensive (expense)/income of equity-accounted investees | (167 | ) | 40 | (36 | ) | ||||||
| Unrealized fair value loss on digital asset | — | (1,351 | ) | — | |||||||
| Item that may be reclassified subsequently to profit or loss: | |||||||||||
| Reclassification of cumulative translation reserve upon disposal of foreign operations | — | (74 | ) | — | |||||||
| Exchange difference on translation of foreign operations | (198 | ) | 328 | 103 | |||||||
| Other comprehensive (expense)/income for the period | (365 | ) | (1,057 | ) | 67 | ||||||
| Total comprehensive expense for the period | $ | (23,470 | ) | $ | (8,599 | ) | $ | (10,949 | ) | ||
| Loss attributable to: | |||||||||||
| Equity shareholders of Prenetics | $ | (23,104 | ) | $ | (7,500 | ) | $ | (10,390 | ) | ||
| Non-controlling interests | — | (42 | ) | (626 | ) | ||||||
| $ | (23,104 | ) | $ | (7,542 | ) | $ | (11,016 | ) | |||
| Total comprehensive expense attributable to: | |||||||||||
| Equity shareholders of Prenetics | $ | (23,470 | ) | $ | (8,592 | ) | $ | (10,243 | ) | ||
| Non-controlling interests | — | (7 | ) | (706 | ) | ||||||
| $ | (23,470 | ) | $ | (8,599 | ) | $ | (10,949 | ) | |||
| Loss per share: | |||||||||||
| Basic | $ | (1.36 | ) | $ | (0.47 | ) | $ | (0.80 | ) | ||
| Diluted | (1.36 | ) | (0.47 | ) | (0.80 | ) | |||||
| Loss per share - Continuing operations: | |||||||||||
| Basic | (1.61 | ) | (0.07 | ) | (0.44 | ) | |||||
| Diluted | (1.61 | ) | (0.07 | ) | (0.44 | ) | |||||
| Weighted average number of common shares: | |||||||||||
| Basic | 16,982,575 | 16,034,309 | 13,003,881 | ||||||||
| Diluted | 16,982,575 | 16,034,309 | 13,003,881 | ||||||||
PRENETICS GLOBAL LIMITED
Unaudited consolidated statements of cash flows
(All amounts in thousands of U.S. dollars (“$”))
| Three Months Ended | |||||
| March 31, | March 31, | ||||
| 2026 | 2025 | ||||
| (Unaudited | ) | (Unaudited | ) | ||
| Cash flows from operating activities | |||||
| Loss for the year | (23,105 | ) | (11,016 | ) | |
| Adjustments for: | |||||
| Bank interest income | (294 | ) | (440 | ) | |
| Depreciation | 159 | 893 | |||
| Amortization of intangible assets | 25 | 239 | |||
| Other finance costs | 9 | 69 | |||
| Fair value loss on financial assets at fair value through profit or loss | 568 | — | |||
| Fair value loss on warrant liabilities | 8,035 | 63 | |||
| Unrealized fair value loss on digital asset | 9,830 | — | |||
| Net foreign exchange losses | (20 | ) | (196 | ) | |
| Gain on disposal of assets | (253 | ) | — | ||
| Write-off on inventories | (32 | ) | 667 | ||
| Gain on disposal of an equity-accounted investee | (4,172 | ) | — | ||
| Share of loss of equity-accounted investees | 113 | 309 | |||
| Equity-settled share-based payment expenses | 1,242 | 1,119 | |||
| Income tax expense/(credit) | 28 | (64 | ) | ||
| (7,867 | ) | (8,357 | ) | ||
| Changes in: | |||||
| Decrease in deferred expenses | — | 2,057 | |||
| Increase in inventories | (7,134 | ) | (711 | ) | |
| Decrease in trade receivables | 451 | 779 | |||
| (Increase)/decrease in deposits, prepayments and other receivables | 2,874 | 1,043 | |||
| Decrease in amounts due from related companies | 4 | — | |||
| Decrease in other non-current assets | 1,255 | 118 | |||
| (Decrease)/increase in trade payables | (1,179 | ) | 469 | ||
| (Decrease)/increase in accrued expenses and other current liabilities | (358 | ) | 926 | ||
| Decrease in contract liabilities | (138 | ) | (300 | ) | |
| Decrease in other non-current liabilities | (4 | ) | (1 | ) | |
| Cash used in operating activities | (12,096 | ) | (3,977 | ) | |
| Income taxes paid | (28 | ) | — | ||
| Net cash used in operating activities | (12,124 | ) | (3,977 | ) | |
| Cash flows from investing activities | |||||
| Payment for purchase of financial assets at fair value through profit or loss | (19,876 | ) | — | ||
| Net cash inflow from disposal of an equity-accounted investee | 69,000 | — | |||
| Interest received | 294 | 440 | |||
| Net cash from investing activities | 49,418 | 440 | |||
| Cash flows from financing activities | |||||
| Capital element of lease rentals paid | (142 | ) | (622 | ) | |
| Interest element of lease rentals paid | (9 | ) | (69 | ) | |
| Proceeds from public placement | (13,117 | ) | — | ||
| Net cash used in financing activities | (13,268 | ) | (691 | ) | |
| Net increase/(decrease) in cash and cash equivalents | 24,026 | (4,228 | ) | ||
| Cash and cash equivalents at the beginning of the period | 32,131 | 52,251 | |||
| Effect of foreign exchange rate changes | (140 | ) | (57 | ) | |
| Cash and cash equivalents at the end of the period | 56,017 | 47,966 | |||
PRENETICS GLOBAL LIMITED
Unaudited Non-IFRS Financial Measures
(All amounts in thousands of U.S. dollars (“$”))
Reconciliation of loss for the period under IFRS Accounting Standards and adjusted EBITDA (Non-IFRS)
| Three Months Ended | |||||||||||
| March 31, | December 31, | March 31, | |||||||||
| 2026 | 2025 | 2025 | |||||||||
| (Unaudited | ) | (Unaudited | ) | (Unaudited | ) | ||||||
| Loss for the period under IFRS Accounting Standards | $ | (23,104 | ) | $ | (7,542 | ) | $ | (11,016 | ) | ||
| Depreciation and amortization | 184 | 273 | 326 | ||||||||
| Interest income | (294 | ) | (210 | ) | (422 | ) | |||||
| Other finance costs | 9 | 12 | 18 | ||||||||
| Income tax expense | 28 | 37 | 20 | ||||||||
| EBITDA | (23,177 | ) | (7,430 | ) | (11,074 | ) | |||||
| Amortization of deferred expenses | — | — | 2,057 | ||||||||
| Equity-settled share-based payment expenses | 1,242 | 1,299 | 1,167 | ||||||||
| Non-recurring expenses related to acquisition, disposal and fundraising | 953 | 4,366 | 126 | ||||||||
| Strategic realignment expenses | 1,252 | 3,750 | 2 | ||||||||
| Exchange gain or loss, net | (71 | ) | 200 | 276 | |||||||
| Fair value loss/(gain) on financial assets at fair value through profit or loss | 568 | (879 | ) | — | |||||||
| Fair value loss on warrant liabilities | 8,035 | 17,339 | 63 | ||||||||
| Gain on warrant exchange | — | (36,657 | ) | — | |||||||
| Unrealized fair value loss on digital assets | 9,830 | 9,725 | — | ||||||||
| (Profit)/loss from discontinued operation, net of tax | (4,231 | ) | 6,451 | 4,944 | |||||||
| Adjusted EBITDA | $ | (5,599 | ) | $ | (1,836 | ) | $ | (2,439 | ) | ||
| Three Months Ended | ||||||||
| March 31, | December 31, | March 31, | ||||||
| 2026 | 2025 | 2025 | ||||||
| (Unaudited) | (Unaudited) | (Unaudited) | ||||||
| Continuing operations | ||||||||
| Selling and marketing expenses | $ | 27 | $ | 24 | $ | 1 | ||
| Research and development expenses | 226 | 90 | 467 | |||||
| Administrative and other operating expenses | 746 | 444 | 456 | |||||
| Total employee equity-settled share-based payment expenses | $ | 999 | $ | 558 | $ | 924 | ||
1 EBITDA is a non-IFRS financial measure used by us to measure the strength of our core financial and operating performance. EBITDA excludes (1) depreciation and amortization, (2) interest income, (3) other finance costs, and (4) income tax expense. For more information regarding this non-IFRS financial measure, see "Unaudited Non-IFRS Financial Measures."
2 Adjusted EBITDA is a non-IFRS financial measure used by us to measure the strength of our core financial and operating performance. Adjusted EBITDA represents EBITDA further adjusted to exclude (1) amortization of deferred expenses, (2) equity-settled share-based payment expenses, (3) non-recurring expenses related to acquisition, disposal and fundraising, (4) strategic realignment expenses, (5) exchange gain or loss, net, (6) fair value loss/(gain) on financial assets at fair value through profit or loss, (7) fair value loss on warrant liabilities, (8) gain on warrant exchange, (9) unrealized fair value loss on digital asset, and (10) (profit)/loss from discontinued operations, net of tax. These adjustments are made for items that may not be indicative of our business performance, including non-cash and/or non-recurring items. For more information regarding this non-IFRS financial measure, see "Unaudited Non-IFRS Financial Measures."
3 The Company uses annualized recurring revenue (“ARR”) as a key operating metric and is calculated by multiplying the monthly revenue from the last month of a given period by 12.
4 Includes equity-settled share-based payment expenses from continuing operations as follows:
5 ACT Genomics, Europa and Insighta are classified as discontinued operations in accordance with IFRS 5. The results of the discontinued operations have been presented separately from the continuing operations in the consolidated statements of profit or loss and other comprehensive income.
A photo accompanying this announcement is available at https://www.globenewswire.com/NewsRoom/AttachmentNg/1a9e11ac-9f38-4820-84e0-218e21ce0f7d

![]()