
A sideways rectangle pattern has emerged in the chart of Total SE (TOT). If either the resistance or support level is broken, a significant move in the stock could occur.
TOT is an integrated oil and gas company that explores for, produces, and refines oil around the world. The company operates refineries with capacity of nearly 2.0 million barrels a day, primarily in Europe, distributes refined products in 65 countries, and manufactures commodity and specialty chemicals.
The company has a strong history of production when compared to other large oil companies. This is due to exposure to the faster growing hydrocarbon producing regions in the world. TOT has also benefited from production from new startups. TOT has been able to lower breakeven cost through modern technology in drilling.
The company had $36.6 billion in cash at the end of the last quarter, compared with $61.5 billion in long-term debt. Though it has a current ratio of 1.4, indicating it has enough liquidity to handle short-term obligations.
While growth has been down over the past year, earnings are expected to rise 7.6% next quarter and 137.9% this year. Revenue is forecasted to rise 31.9% this year. The stock appears undervalued with a 12.68 trailing P/E.
TOT has shown positive mid-term momentum, but is down over 5% in the past five days. This has led to a Buy rating in our POWR Ratings system and is reflected in the chart below.
Take a look at the 1-year chart of TOT below with added notations:
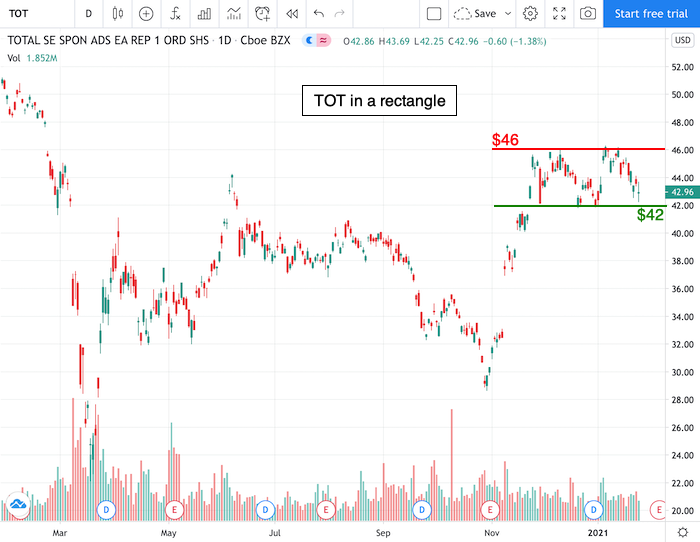
Over the past couple of months, TOT has rallied up into a sideways trading range. While in the range, the stock has formed a resistance level at $46 (red), and a level of support at around $42 (green). At some point, the stock will have to either break the resistance or the support.
The possible long positions on the stock would be on a breakout above $46. The ideal short opportunity would be on a break below $42.
Want to Discover More Great Trades?
I have explored virtually every flavor of technical analysis and chart pattern known to mankind. The sad fact is that the vast majority of them don’t work at all.
That is why I recently put together this special report to help investors focus on the only 5 chart patterns that matter…the ones that lead to the most timely and profitable stock trades. Click below to get your copy now!
5 WINNING Stock Chart Patterns
Have a good trading day!
Good luck!
Christian Tharp, CMT
TOT shares were trading at $43.80 per share on Thursday morning, up $0.84 (+1.96%). Year-to-date, TOT has gained 4.51%, versus a 1.12% rise in the benchmark S&P 500 index during the same period.
About the Author: Christian Tharp, CMT

Christian is an expert stock market coach at the Adam Mesh Trading Group who has mentored more than 4,000 traders and investors. He is a professional technical analyst that is a certified Chartered Market Technician (CMT), which is a designation awarded by the CMT Association. Christian is also the author of the daily online newsletter Todays Big Stock.
The post Why You Can Expect a Significant Move in Total SE appeared first on StockNews.com