
 ( click to enlarge )
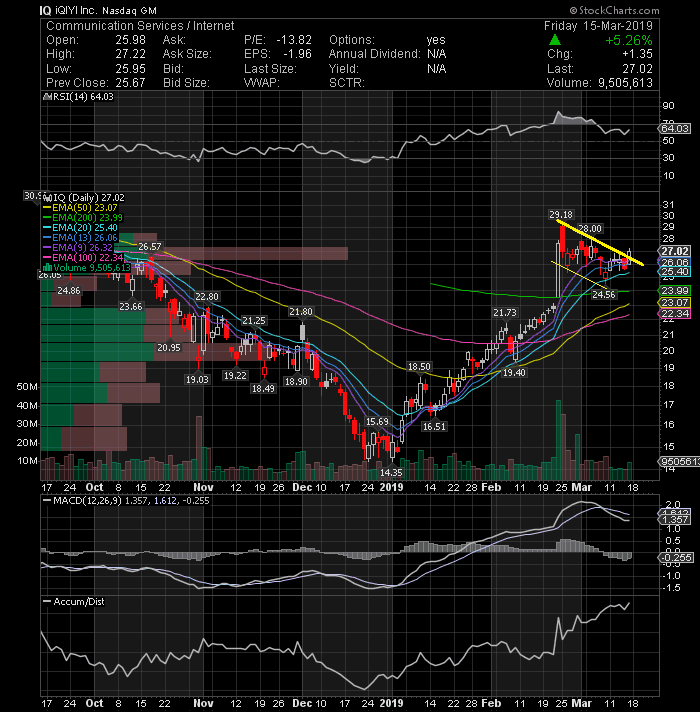
IQIYI Inc (NASDAQ: IQ) has been in a consolidation over the last three weeks forming a bullish flag pattern after a big surge in price and volume in February. The stock jumped 5% Friday and closed at 27.02, two cents above key the psychological price level of 27. If it holds this level on Monday this could be the start of new momentum that could move the stock toward the 29 area.
 ( click to enlarge )
Goldman Sachs Group Inc (NYSE: GS) has been trading in a sideways range between resistance at 202.5 and support at 189 for a few months. With MACD showing good upside potential and RSI on the rise the trend should resume to the upside. Long setup on watch. Buy set at 202.5
 ( click to enlarge )
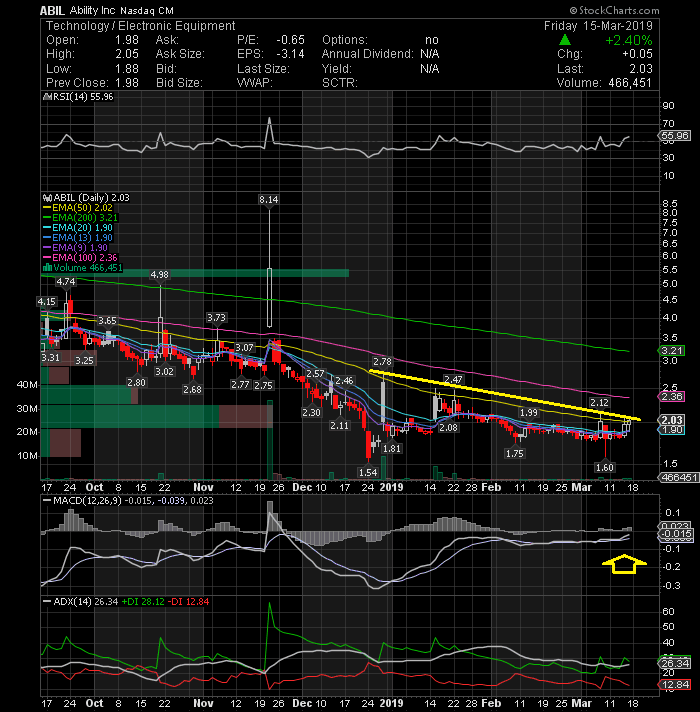
Ability Inc (NASDAQ: ABIL) is a candidate to be traded in breakout mode. The daily technical indicators are looking better for the stock with MACD indicator above its sell signal line, the ADX value is increasing and RSI indicator moving up from the 50 level. It is one for the bottom pickers. Volume was on the light side, but once the stock breaks out we'll see an upturn in buying. Key resistance is now located at $2.05, a break above this level will confirm the bullish trend and the following uptrend will take price up to $2.8 zone.
 ( click to enlarge )
We are on the verge of a possible breakout in the shares of ShiftPixy Inc (NASDAQ: PIXY). The stock looks like it could be getting ready to go imho. PIXY is worth a close look.
 ( click to enlarge )
Leap Therapeutics Inc (NASDAQ: LPTX) needs to take out $2.46. The break of the resistance line with heavy volume should be the next buy point on LPTX. Technical chart shows bullish sign with %K line on top of %D line and MACD on top of signal line.
 ( click to enlarge )
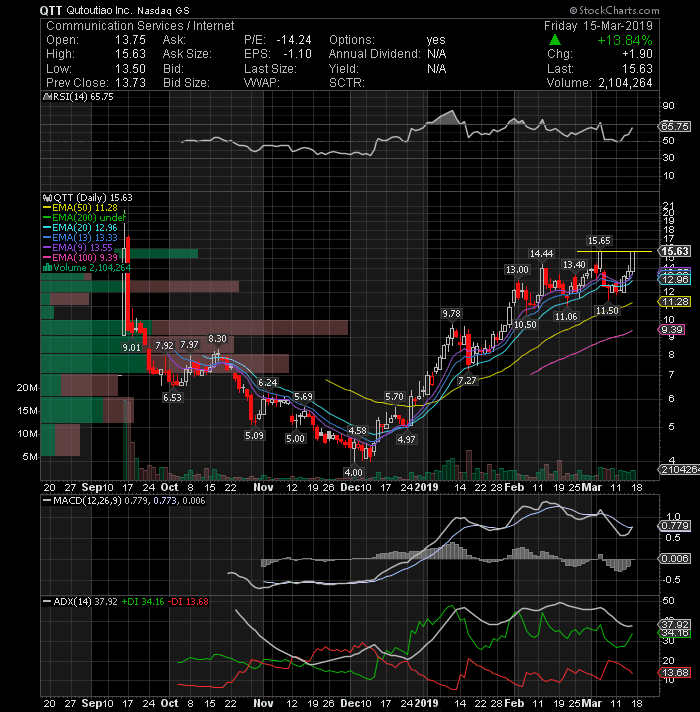
Qutoutiao Inc (NASDAQ: QTT) made a strong run the last hour of the day, closing at highs. The $15.65 level is an obstacle for this stock. If it can break through, buy the stock and watch it take off using the rising EMA9 as a stop loss.
 ( click to enlarge )
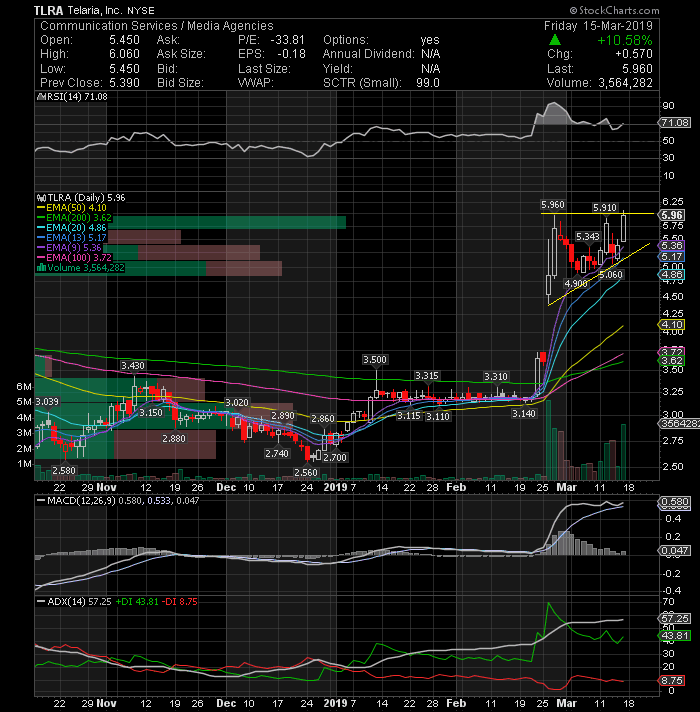
Telaria Inc (NYSE: TLRA) is starting to make a move to break through the top of its range. This is a good stock to watch and once it breaks through $6 on a close basis, the stock should move.
 ( click to enlarge )
Riot Blockchain Inc (NASDAQ: RIOT) above $3.99 could spark a nice short-squeeze. The stock had a nice surge a few days ago and has been in the process of consolidating. I think the stock has room to go higher. Watch the stock closely next week.
 ( click to enlarge )
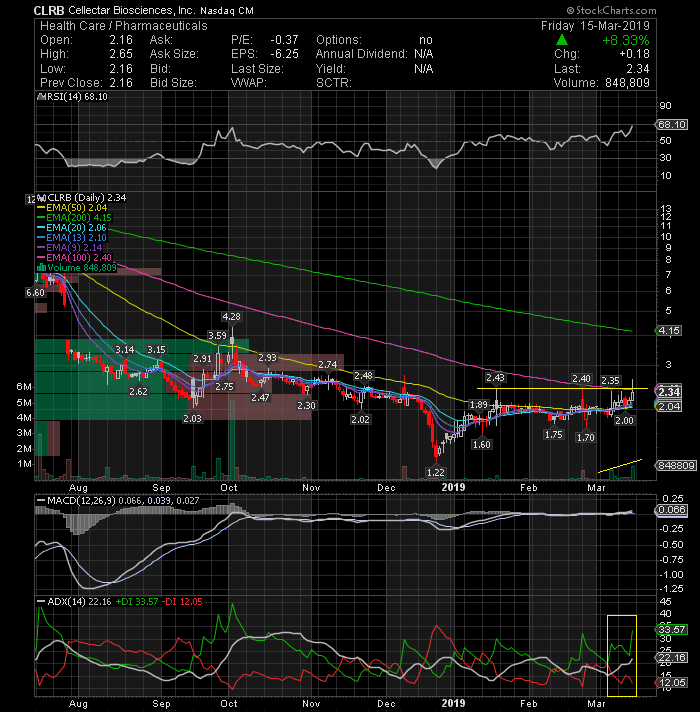
Cellectar Biosciences Inc (NASDAQ: CLRB) Volume starts to pick up. Could make a huge move to the upside. Keep it on your watch list. A break of $2.50 with force might give CLRB room to $3
 ( click to enlarge )
Tetraphase Pharmaceuticals Inc (NASDAQ: TTPH) broke through resistance at $1.39 accompanied with high volume. We should be able to see some decent upside movement for the bulls here.
 ( click to enlarge )
Oragenics Inc (NYSEAMERICAN: OGEN) made big moves on volume in after hours trading Friday. The strength of current momentum could extend Monday and push the stock above the previous high set in Feb at 99c. If this breakout occurs we could see the stock trading in the $1.2-$1.35 area in the next couple of trading days. We should be able to see some decent upside movement for the bulls here. Long setup on watch.
 ( click to enlarge )
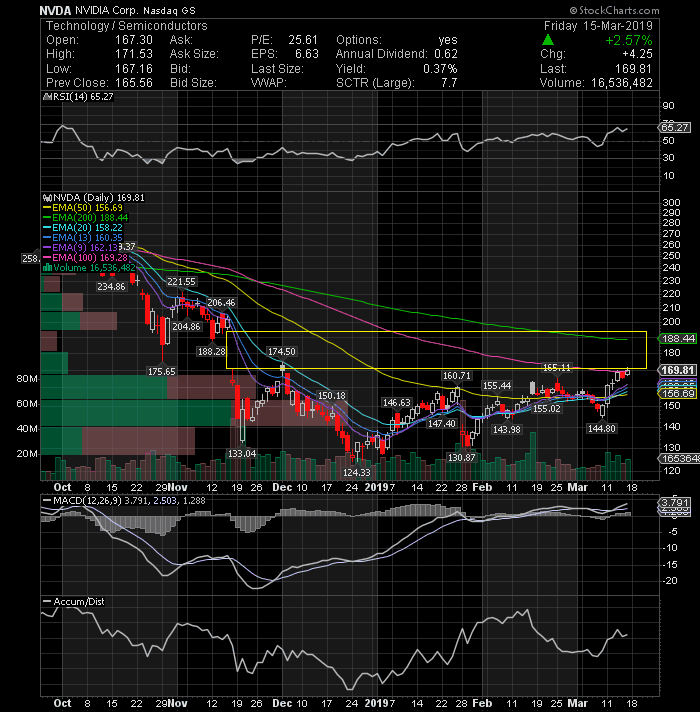
Nvidia (NASDAQ: NVDA) has a gap to fill over 170 on the daily chart should still be more upside left in this one. Long setup on watch.
During the day I tweet many times to my readers. I encourage everybody to subscribe AC Investor Blog twitter and newsletter, so you can receive my trade ideas and stock news in real time.
Disclaimer : This is not an investment advisory, and should not be used to make investment decisions. Information in AC Investor Blog is often opinionated and should be considered for information purposes only. No stock exchange anywhere has approved or disapproved of the information contained herein. There is no express or implied solicitation to buy or sell securities. The charts provided here are not meant for investment purposes and only serve as technical examples. Don't consider buying or selling any stock without conducting your own due diligence.
Thanks for visiting AC Investor Blog.
AC
