
 ( click to enlarge )
The Index broke last week the rising wedge chart pattern formation to the downside (bearish reversal) that has been formed since the February low. This fact suggests a potential bearish continuation next week testing 2007/2000 region in nearest term. Daily technical indicators are bullish but showing signs of weakness. The MACD is positive but is about to cross below its signal line. The RSI and Slow stochastic are showing negative divergences on daily by failing to touch new highs with the index. I expect the correction to continue for a few more sessions.
 ( click to enlarge )
Medivation Inc (NASDAQ:MDVN) is getting some buying and looks poised to post some nice gains if the buying volume persists. The stock displayed relative strength Friday and broke out above the previous high, closing the day slightly below the declining 200-day exponential moving average. From a technical perspective, the MACD is moving up showing positive momentum while KD line also show buy signal as %K line is on top of %D line. Continue to keep this stock on your radar.
 ( click to enlarge )
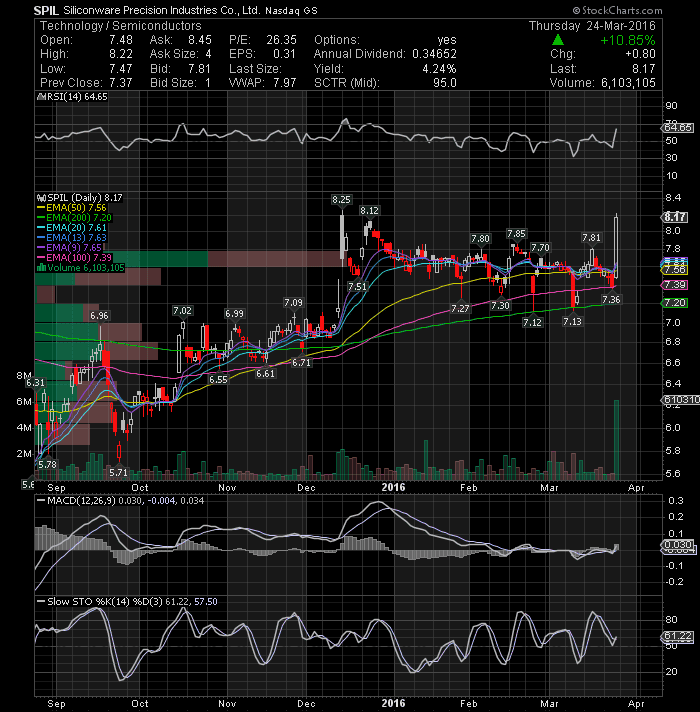
Siliconware Precision Industries (NASDAQ:SPIL) surged 10% or 80 cents to $8.17 per share on unusual volume. If the stock continues to get attention it could break the $8.25 mark next week, which would be a remarkable gain. Keep a close eye on the stock for the follow through move.
 ( click to enlarge )
McCormick & Company, Incorporated (NYSE:MKC) broke above previous highs of 96.20 on really good volume and finished the week at a record high. The stock hit a high of $96.46, which is now resistance for Monday’s continuation move. All exponential moving averages are below turning up for support. I like this stock for a swing trade.
 ( click to enlarge )
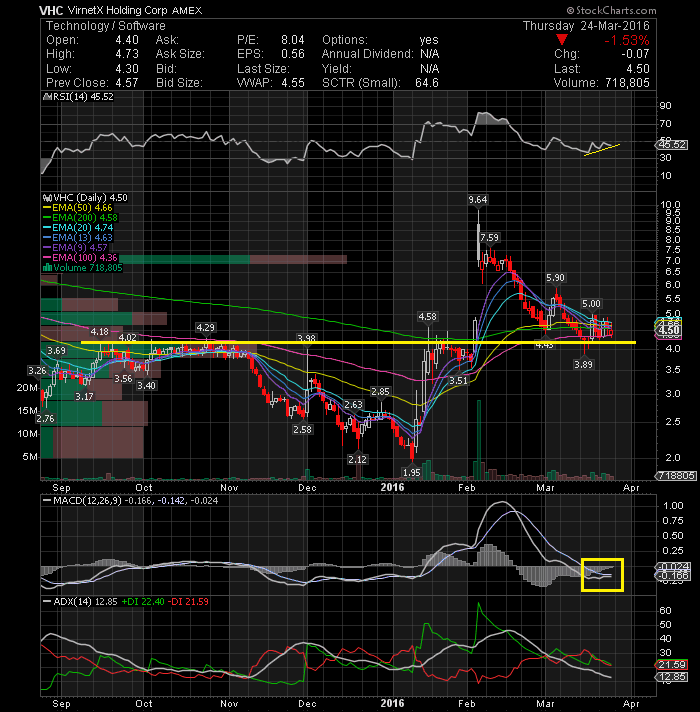
VirnetX Holding Corporation (NYSEMKT:VHC) shares are attractive since its near to the major support level (Yellow Horizontal line). As long as the support is there, I do not think its a problem to include it in your short to medium-term portfolio. I will maintain long exposure, so long as the stock stays above this support level. VHC also has about 24.4% of its shares outstanding sold short, which will produce more buying pressure as shorts run to cover, if and when the stock can break above the $5 zone. Plus, the daily technical indicators are looking better now for the stock. The MACD Histogram and RSI are showing a positive divergence, some hope that we could see a move to the upside. Keep the stock on your radar since it could make a solid move upwards. Stop $3.95
 ( click to enlarge )
Netflix, Inc. (NASDAQ:NFLX) On the daily technical chart, the stock seems to be forming an ascending triangle pattern, possibly suggesting extension of the recent recovery. However, some momentum indicators are showing some signs of weakness. This pattern will remain valid as long as the stock remains at or above the rising 20-day moving average, currently situated at 97.96. On the upside, the stock needs to break decisively above the declining 100-day exponential moving average in order to confirm the bullish momentum.
 ( click to enlarge )
Advance Auto Parts, Inc. (NYSE:AAP) Volume picking up but the stock needs to break this resistance zone first to me. From the daily technical chart KD line shows positive signals as %K line is rising on top over %D line, RSI and MACD continue moving up. Looks good but I prefer to wait for a clean breakout.
Applications are getting more and more attention in the financial world. A friend recommended this application to me a few days ago by email, and I decided to share with everybody. It is very easy to use. Stockal has a pretty interesting way of revealing trending stocks everyday. It combines signals from Analyst Confidence, Trader Sentiment and News which they gather from 200 Wall St. firms, trader conversations and analyst reports. These stocks are likely to move or are moving already.
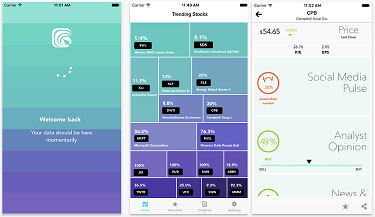
This app "Stockal" covers 6,000+ stocks and gives analyst reports, curated news bytes, social chatter & revenue prediction - all in one place. It's like having your own little Dashboard. You can create a Watchlist, your own journals (Clipbooks) etc. Interesting stuff - check them out. iPhone app HERE and Android HERE Feel free to check it out.
Disclaimer : This is not an investment advisory, and should not be used to make investment decisions. Information in AC Investor Blog is often opinionated and should be considered for information purposes only. No stock exchange anywhere has approved or disapproved of the information contained herein. There is no express or implied solicitation to buy or sell securities. The charts provided here are not meant for investment purposes and only serve as technical examples. Don't consider buying or selling any stock without conducting your own due diligence.
Thanks for visiting AC Investor Blog.
AC
